🧬 PersADE Tutorial Showcase
Interactive demonstration of the comprehensive drug safety platform with 8 specialized modules for drug-adverse event analysis
🔍 Basic Search
Master the fundamental search methods for drugs, adverse events, and protein targets
🎯 PersADE Search Interface Walkthrough
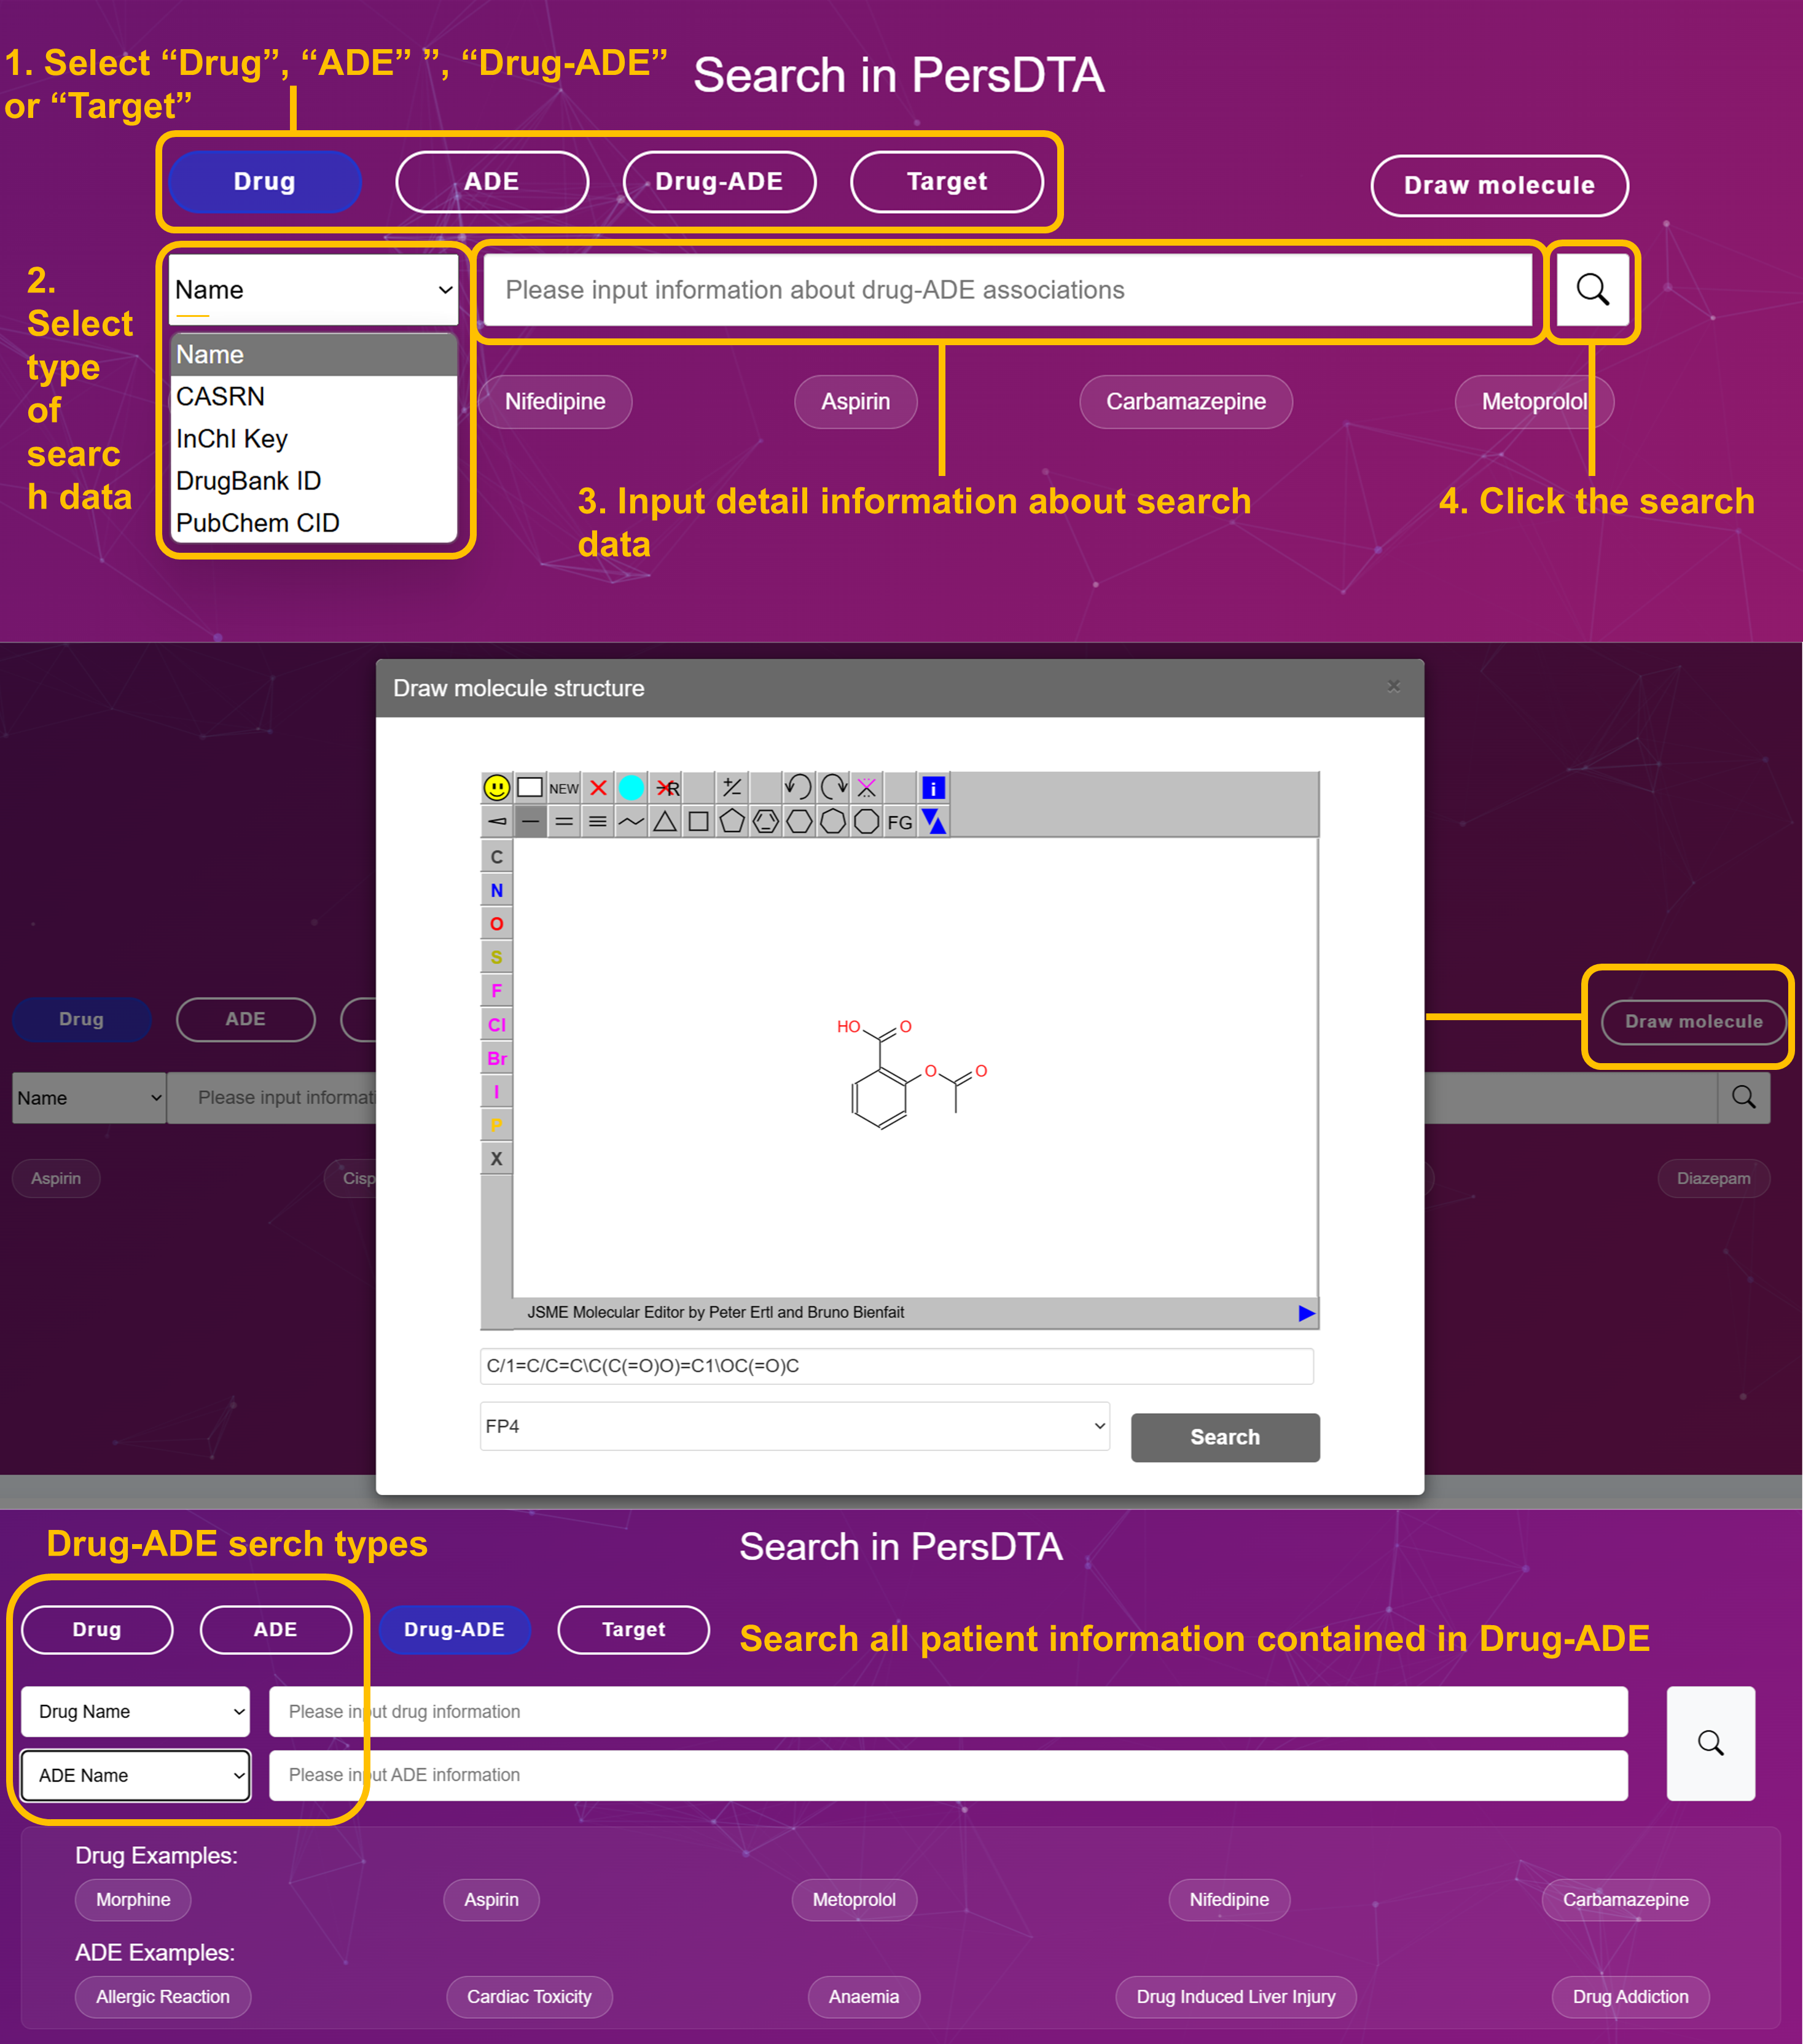
Select Search Type: "Drug", "ADE" or "Target"
Choose your search category from the main interface. Drug (blue button) for pharmaceuticals, ADE (purple button) for adverse events, or Target (purple button) for protein targets.
Select Data Type from Dropdown
Choose the appropriate identifier: Name, CASRN, InChI Key, DrugBank ID, PubChem CID for drugs; Name, UMLS ID, MeSH ID for ADEs; Gene Symbol, UniProt ID, Name for targets.
Input Search Query
Enter your search terms. Examples: Cisplatin, Metformin, Nifedipine for drugs; Myalgia, Anemia, Cardiac Arrest for ADEs; BRCA1, TP53, NFKB1 for targets.
Execute Search & Analyze Results
Click the search button and review results with match percentages, molecular structures, and comprehensive data profiles.
📊 Drug Search Results - Sorting and Navigation
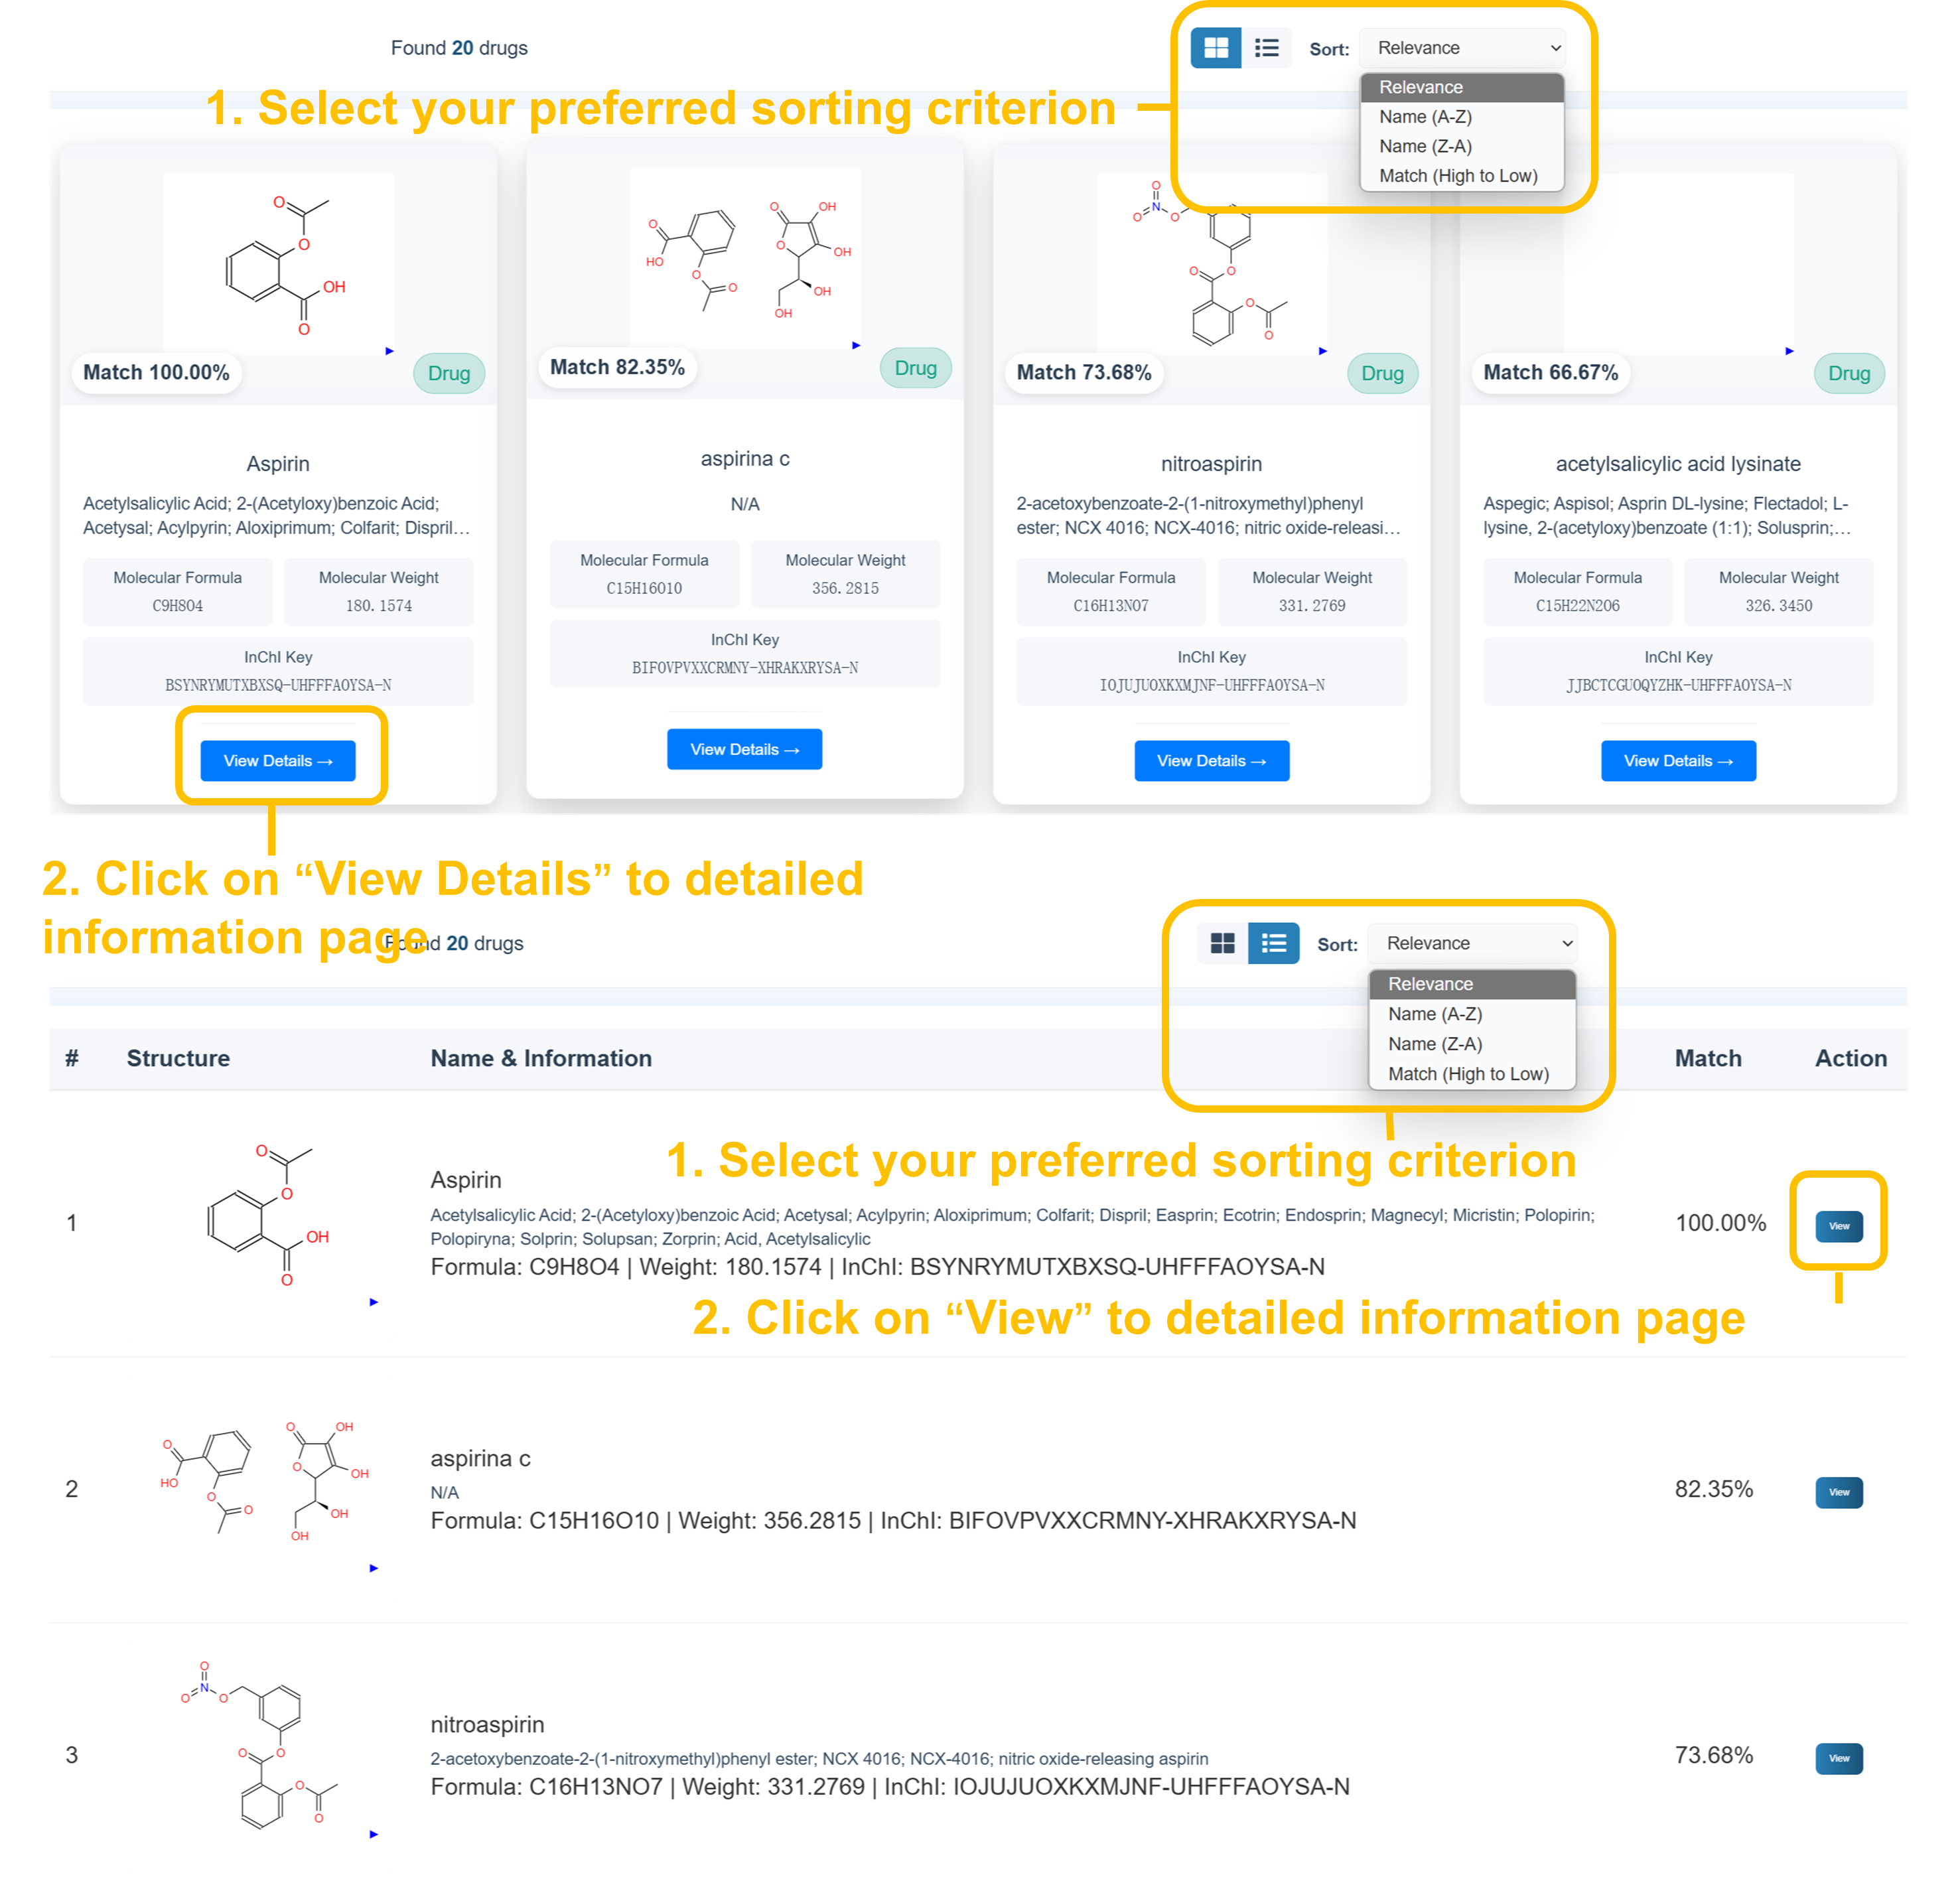
Select your preferred sorting criterion from the dropdown menu (Relevance, Name A-Z, Name Z-A, Match High to Low) and use card or list view options. Click "View Details" to access comprehensive drug information pages with molecular structures, chemical properties, and safety data.
⚠️ ADE Search Results - Medical Terminology
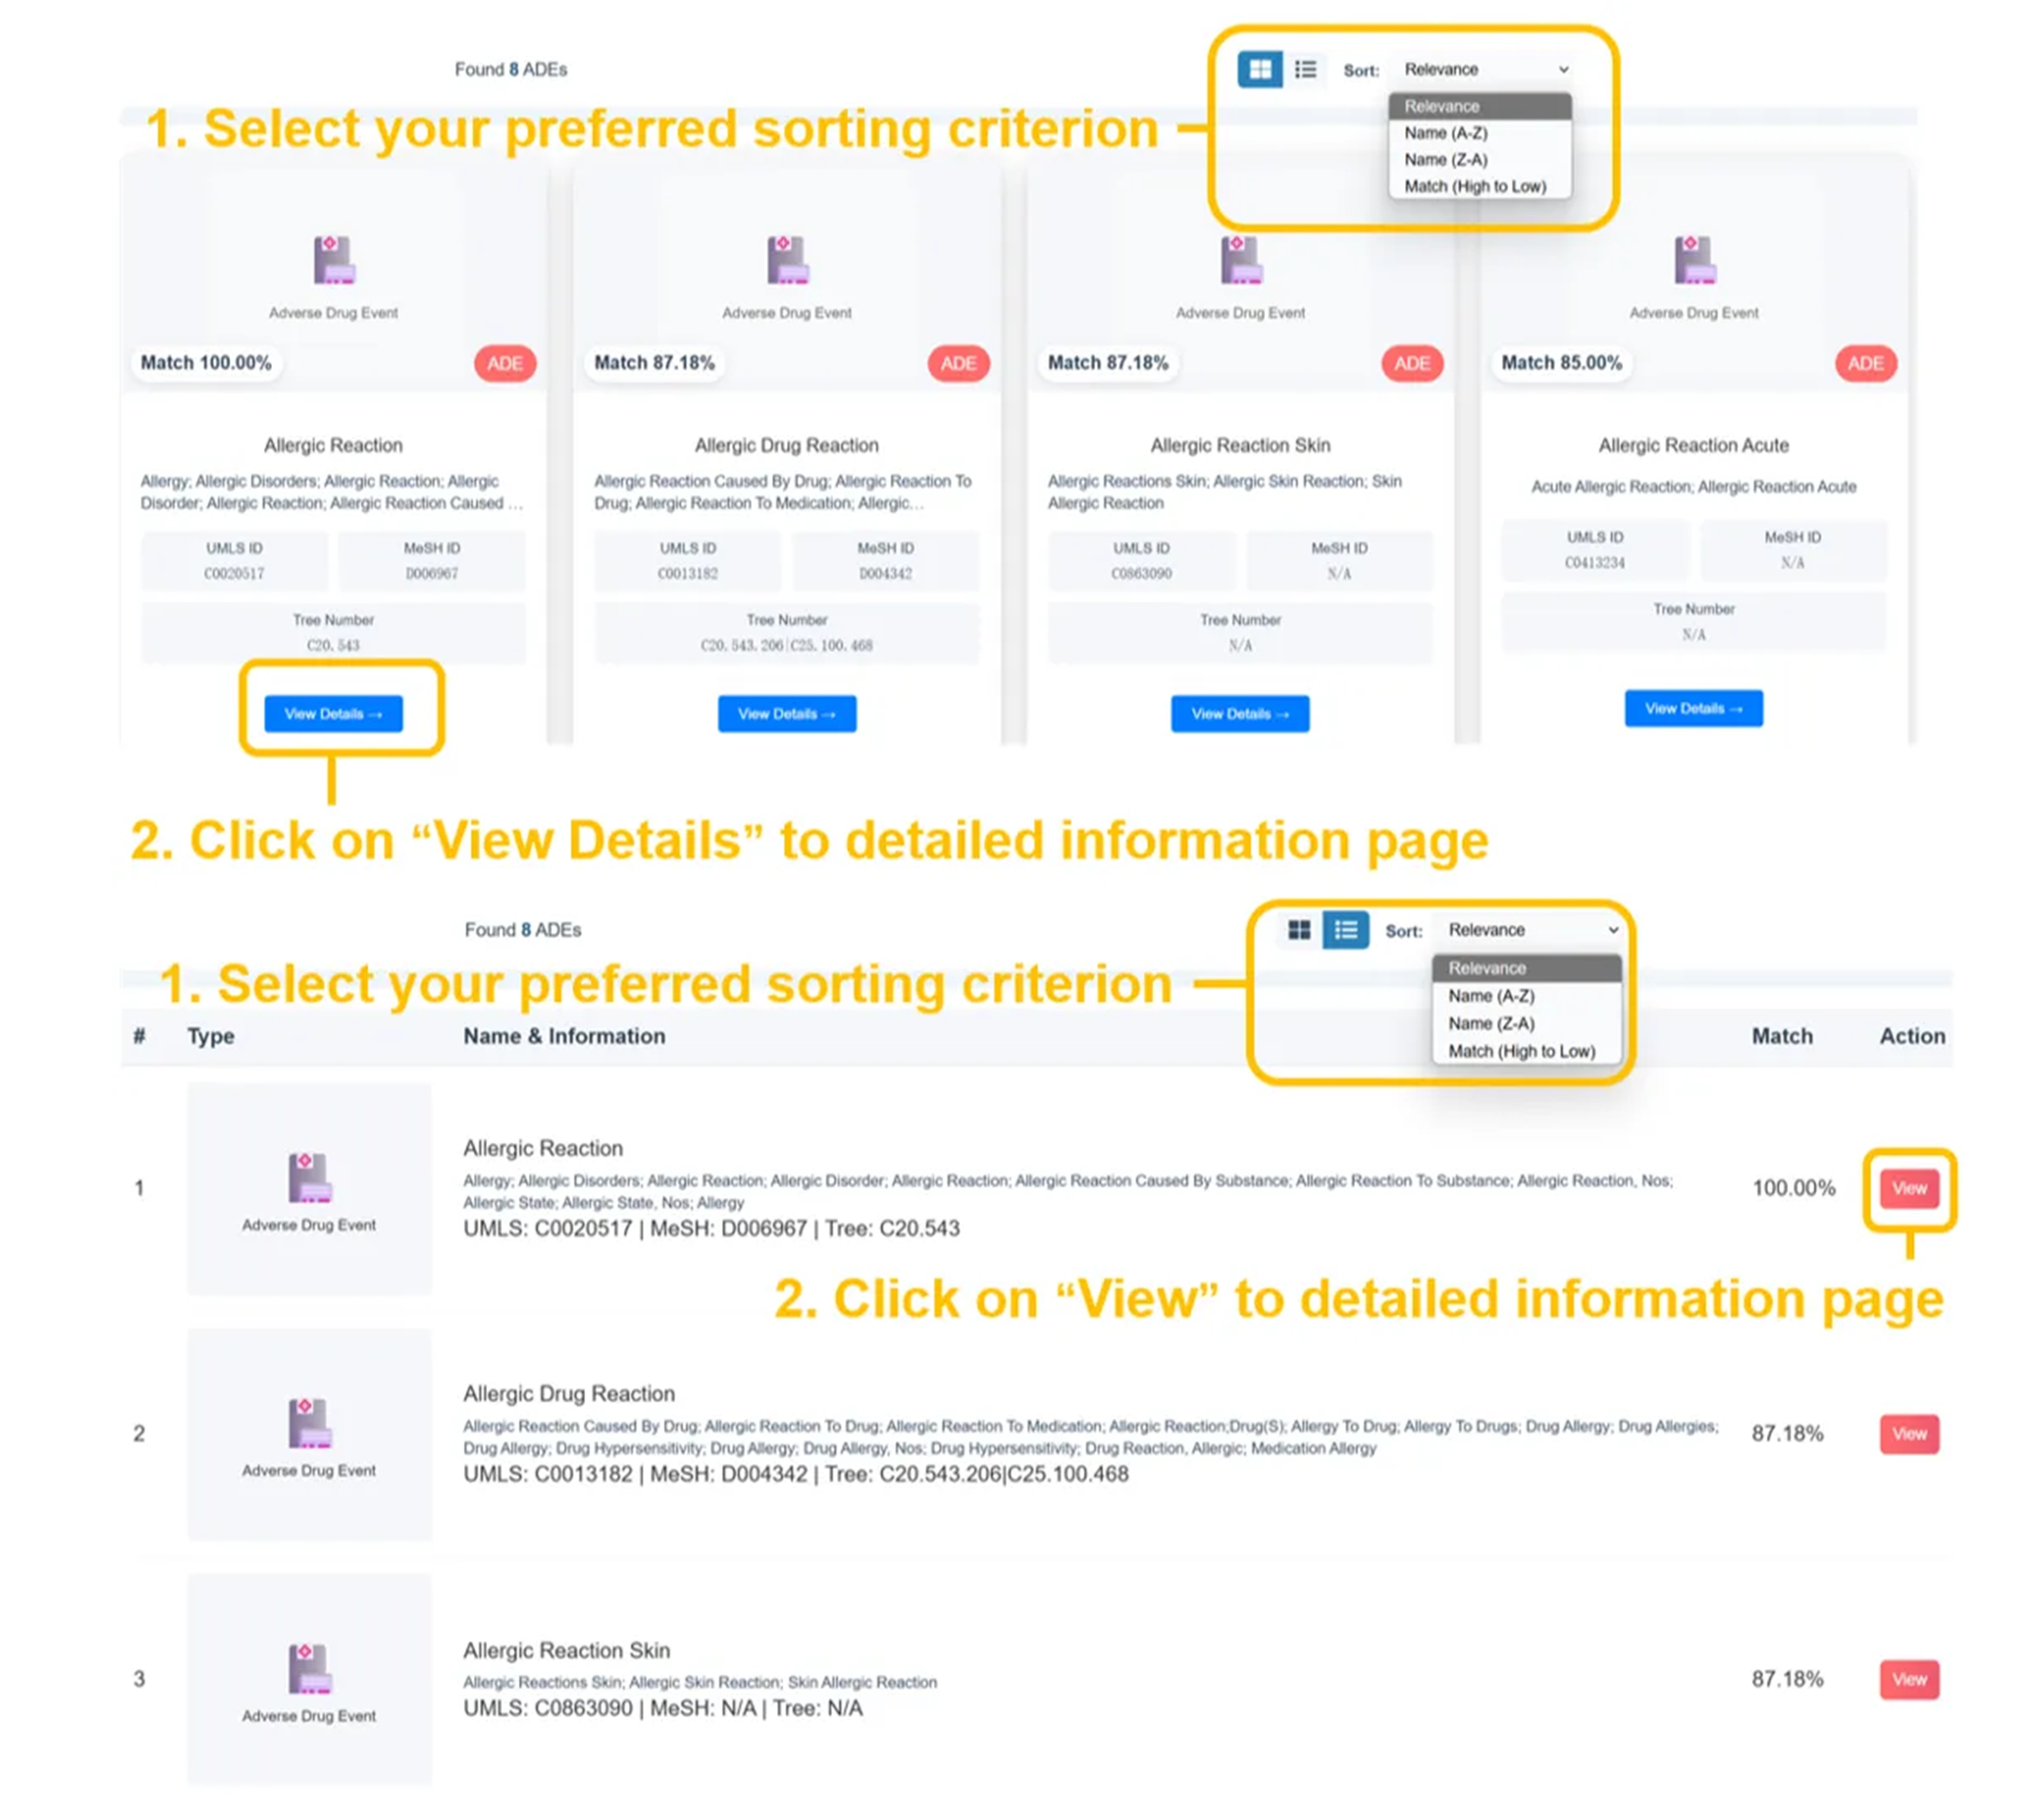
Found several ADEs with precise match percentages (eg. Allergic Reaction 100.00%, Allergic Drug Reaction 87.18%, etc.). Results display UMLS IDs, MeSH IDs, Tree Numbers, and comprehensive medical terminology with color-coded ADE tags for easy identification.
🎯 Target Search Results - Protein Information
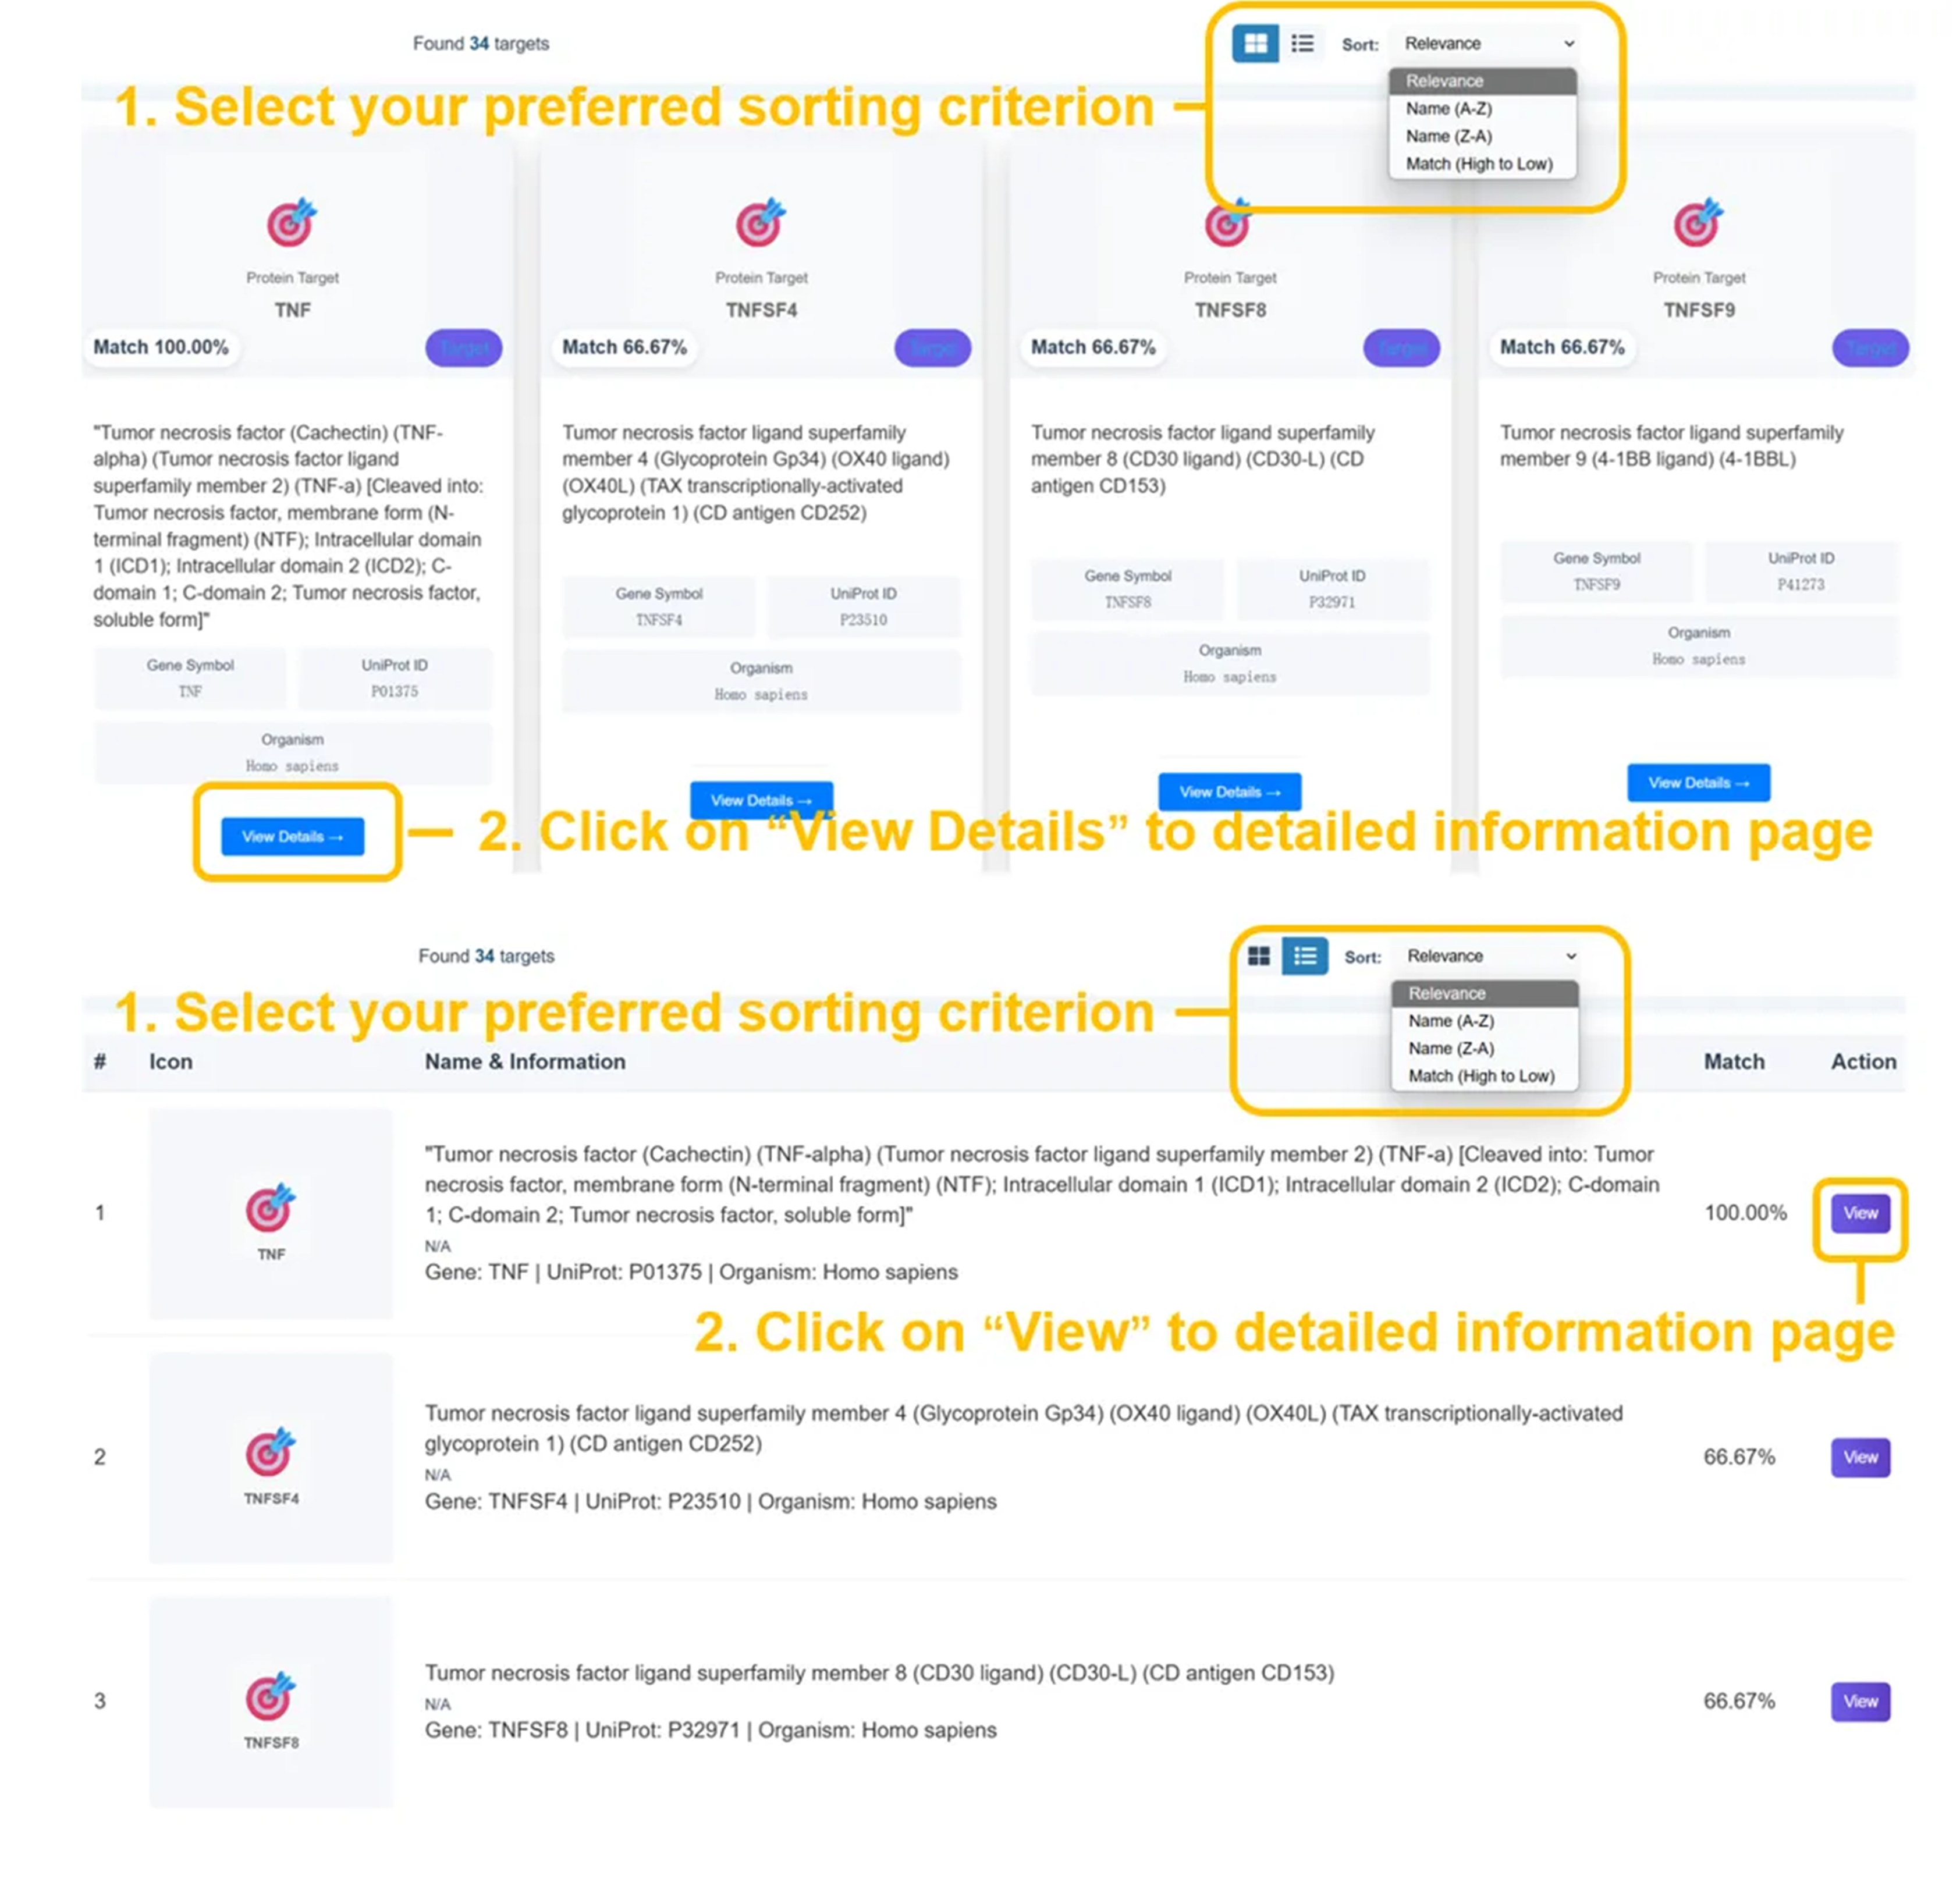
Found several targets with detailed protein information. Results show gene symbols, UniProt IDs, functional descriptions, and organism classification (Homo sapiens) with direct access to detailed target profiles.
Drug Search Results
- Found several drugs matching your query (100.00% match)
- 2D molecular structure visualization
- Molecular formula, weight, InChI keys
- Chemical identifiers and cross-references
- Therapeutic classifications and safety data
ADE Search Results
- Found several ADEs matching your query (100.00% match)
- Tree number hierarchical organization
- Standardized medical terminology
- Color-coded severity indicators
Target Search Results
- Found several similar protein targets with detailed info
- Gene symbols and UniProt integration
- Functional protein descriptions
- Organism classification (Homo sapiens)
- Interactive protein network access
🧬 Advanced Search
Sophisticated chemical similarity, semantic analysis, and patient cohort research
👥 Patient Search Interface Walkthrough
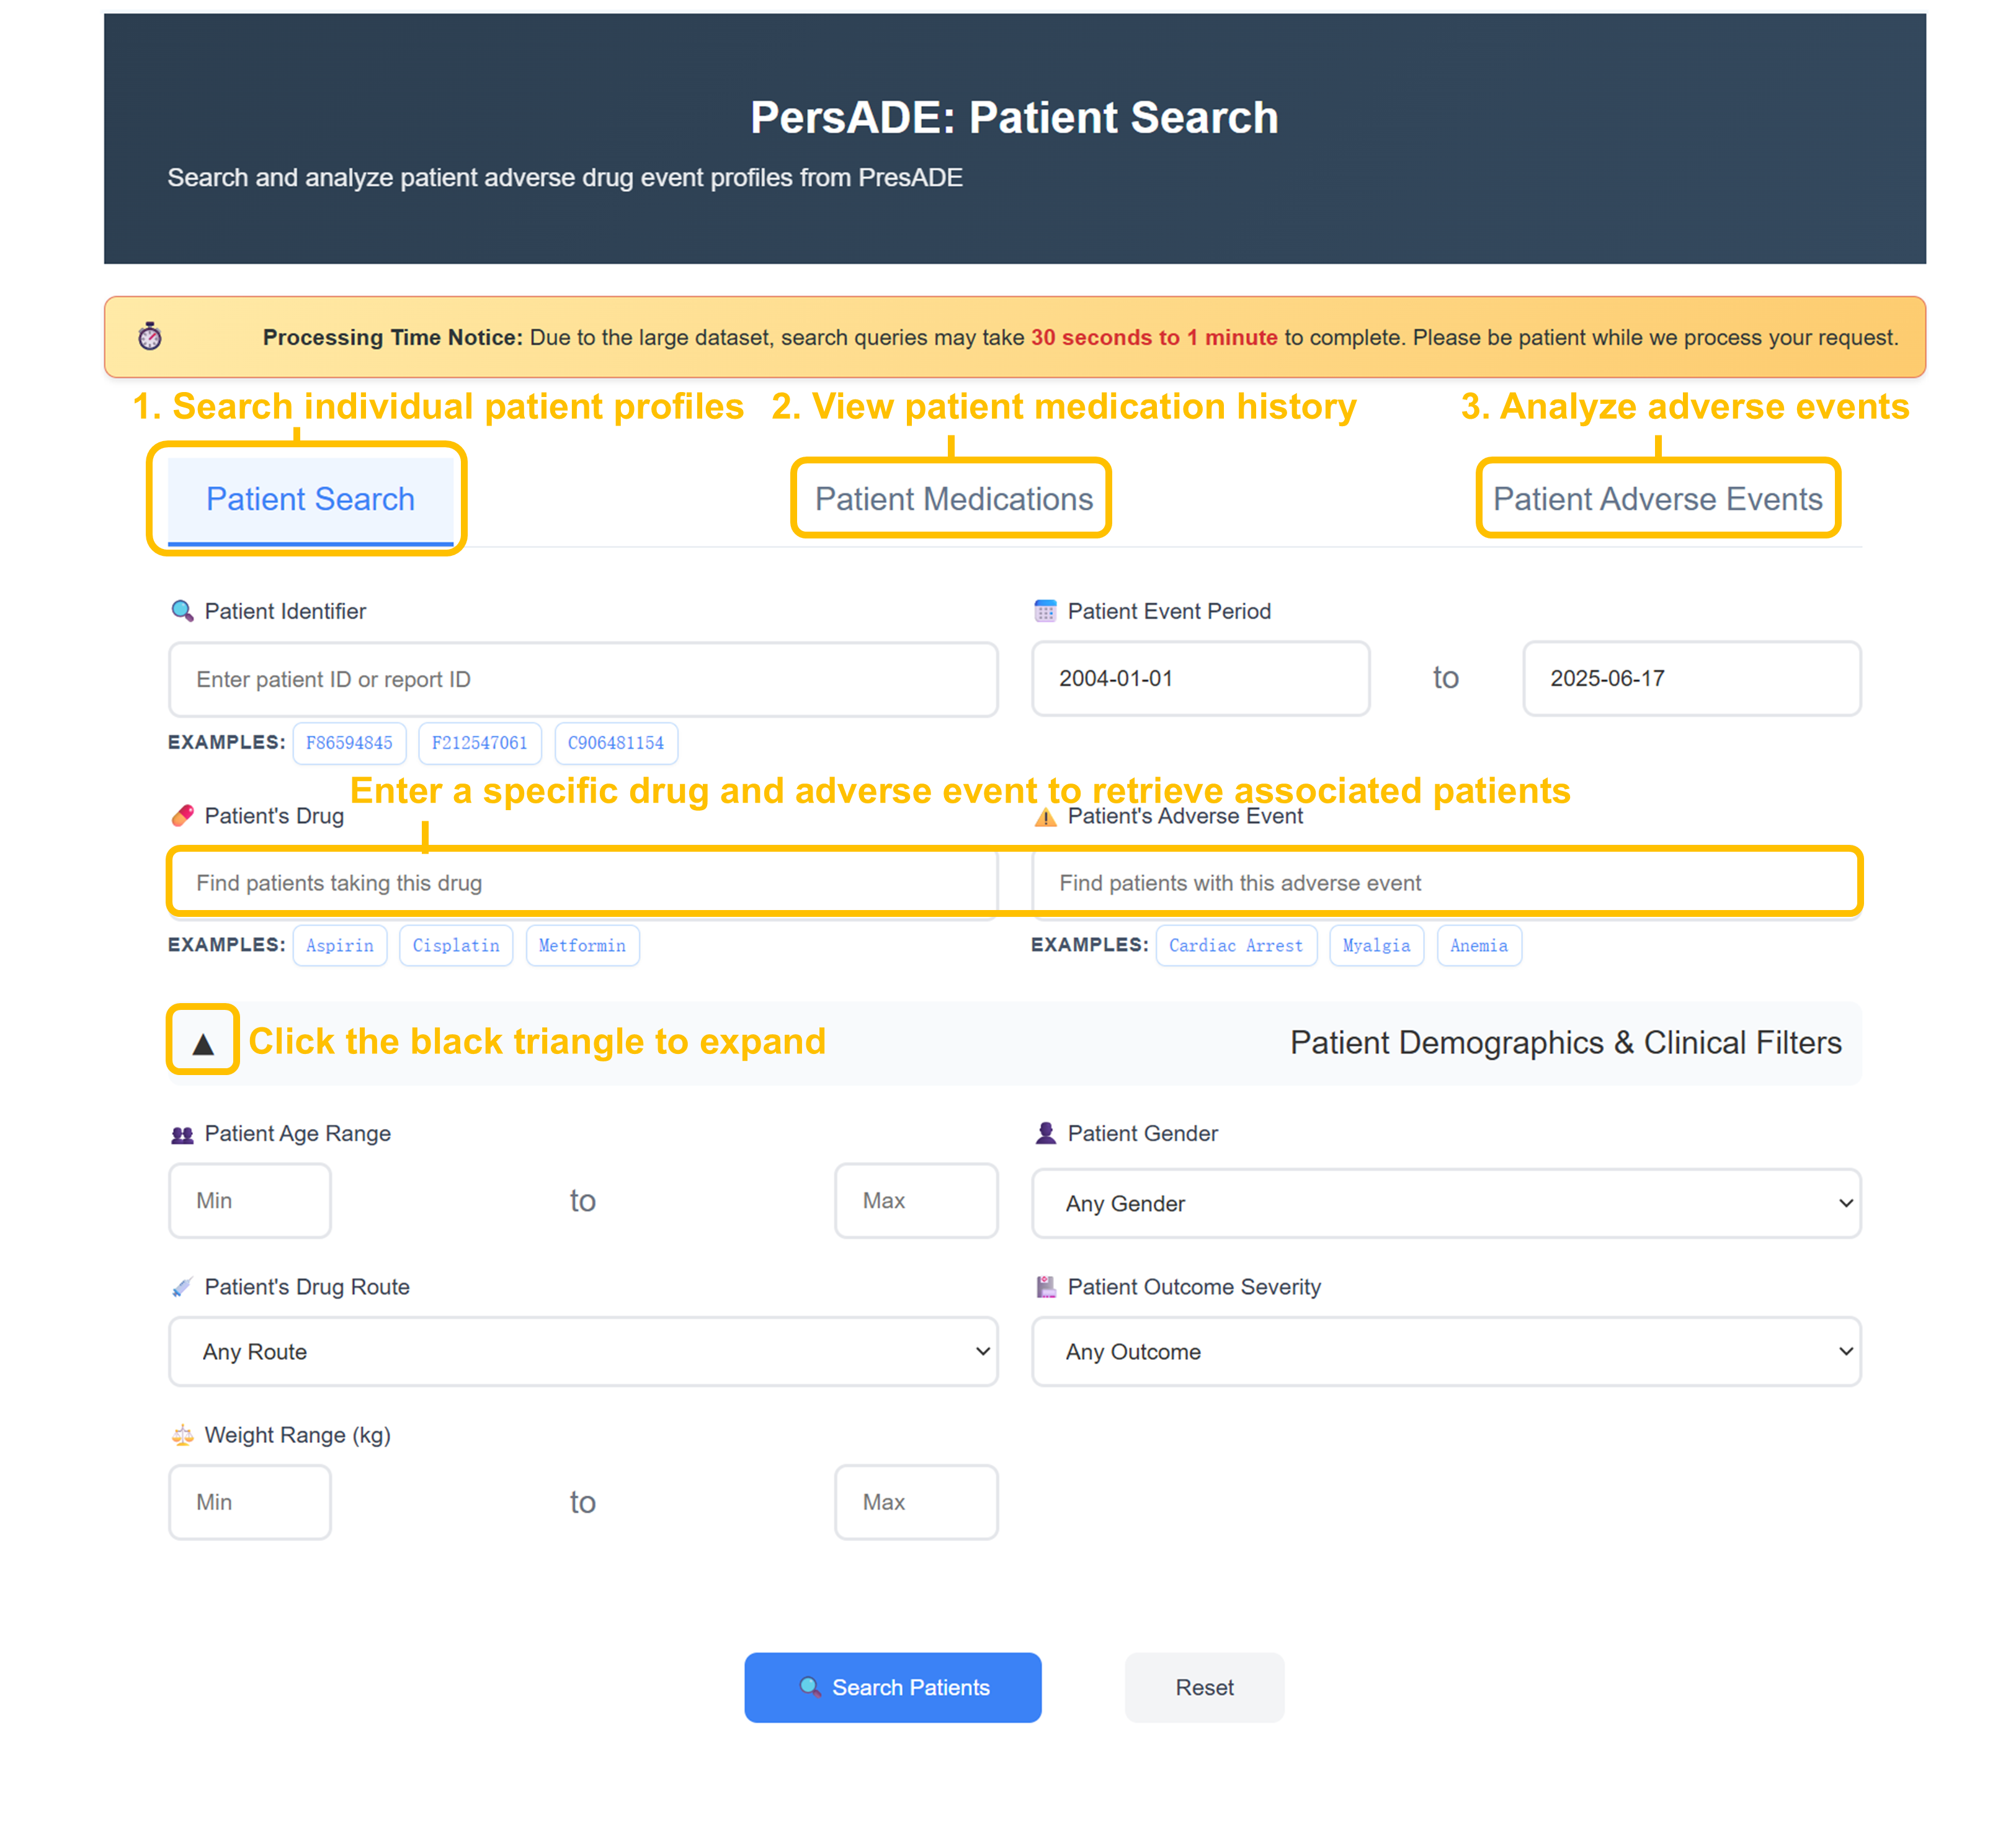
Select Patient Search Function
Choose from three search tabs: "Patient Search" for individual profiles, "Patient Medications" for drug history analysis, or "Patient Adverse Events" for ADE investigation.
Enter Search Criteria
Input specific Patient ID (F56594845, F212547061), drug names (Aspirin, Cisplatin, Metformin), or adverse events (Cardiac Arrest, Myalgia, Anemia) in respective search fields.
Configure Advanced Filters
Set Patient Event Period (2004-01-01 to 2025-06-17), apply demographic filters (age range, gender), drug route, outcome severity, and weight range for targeted analysis.
Execute Patient Search
Click "Search Patients" to retrieve comprehensive patient cohorts with detailed pharmacology, drug information, adverse events, and demographics data for analysis.
📊 Patient Search Results - Demographics & Export
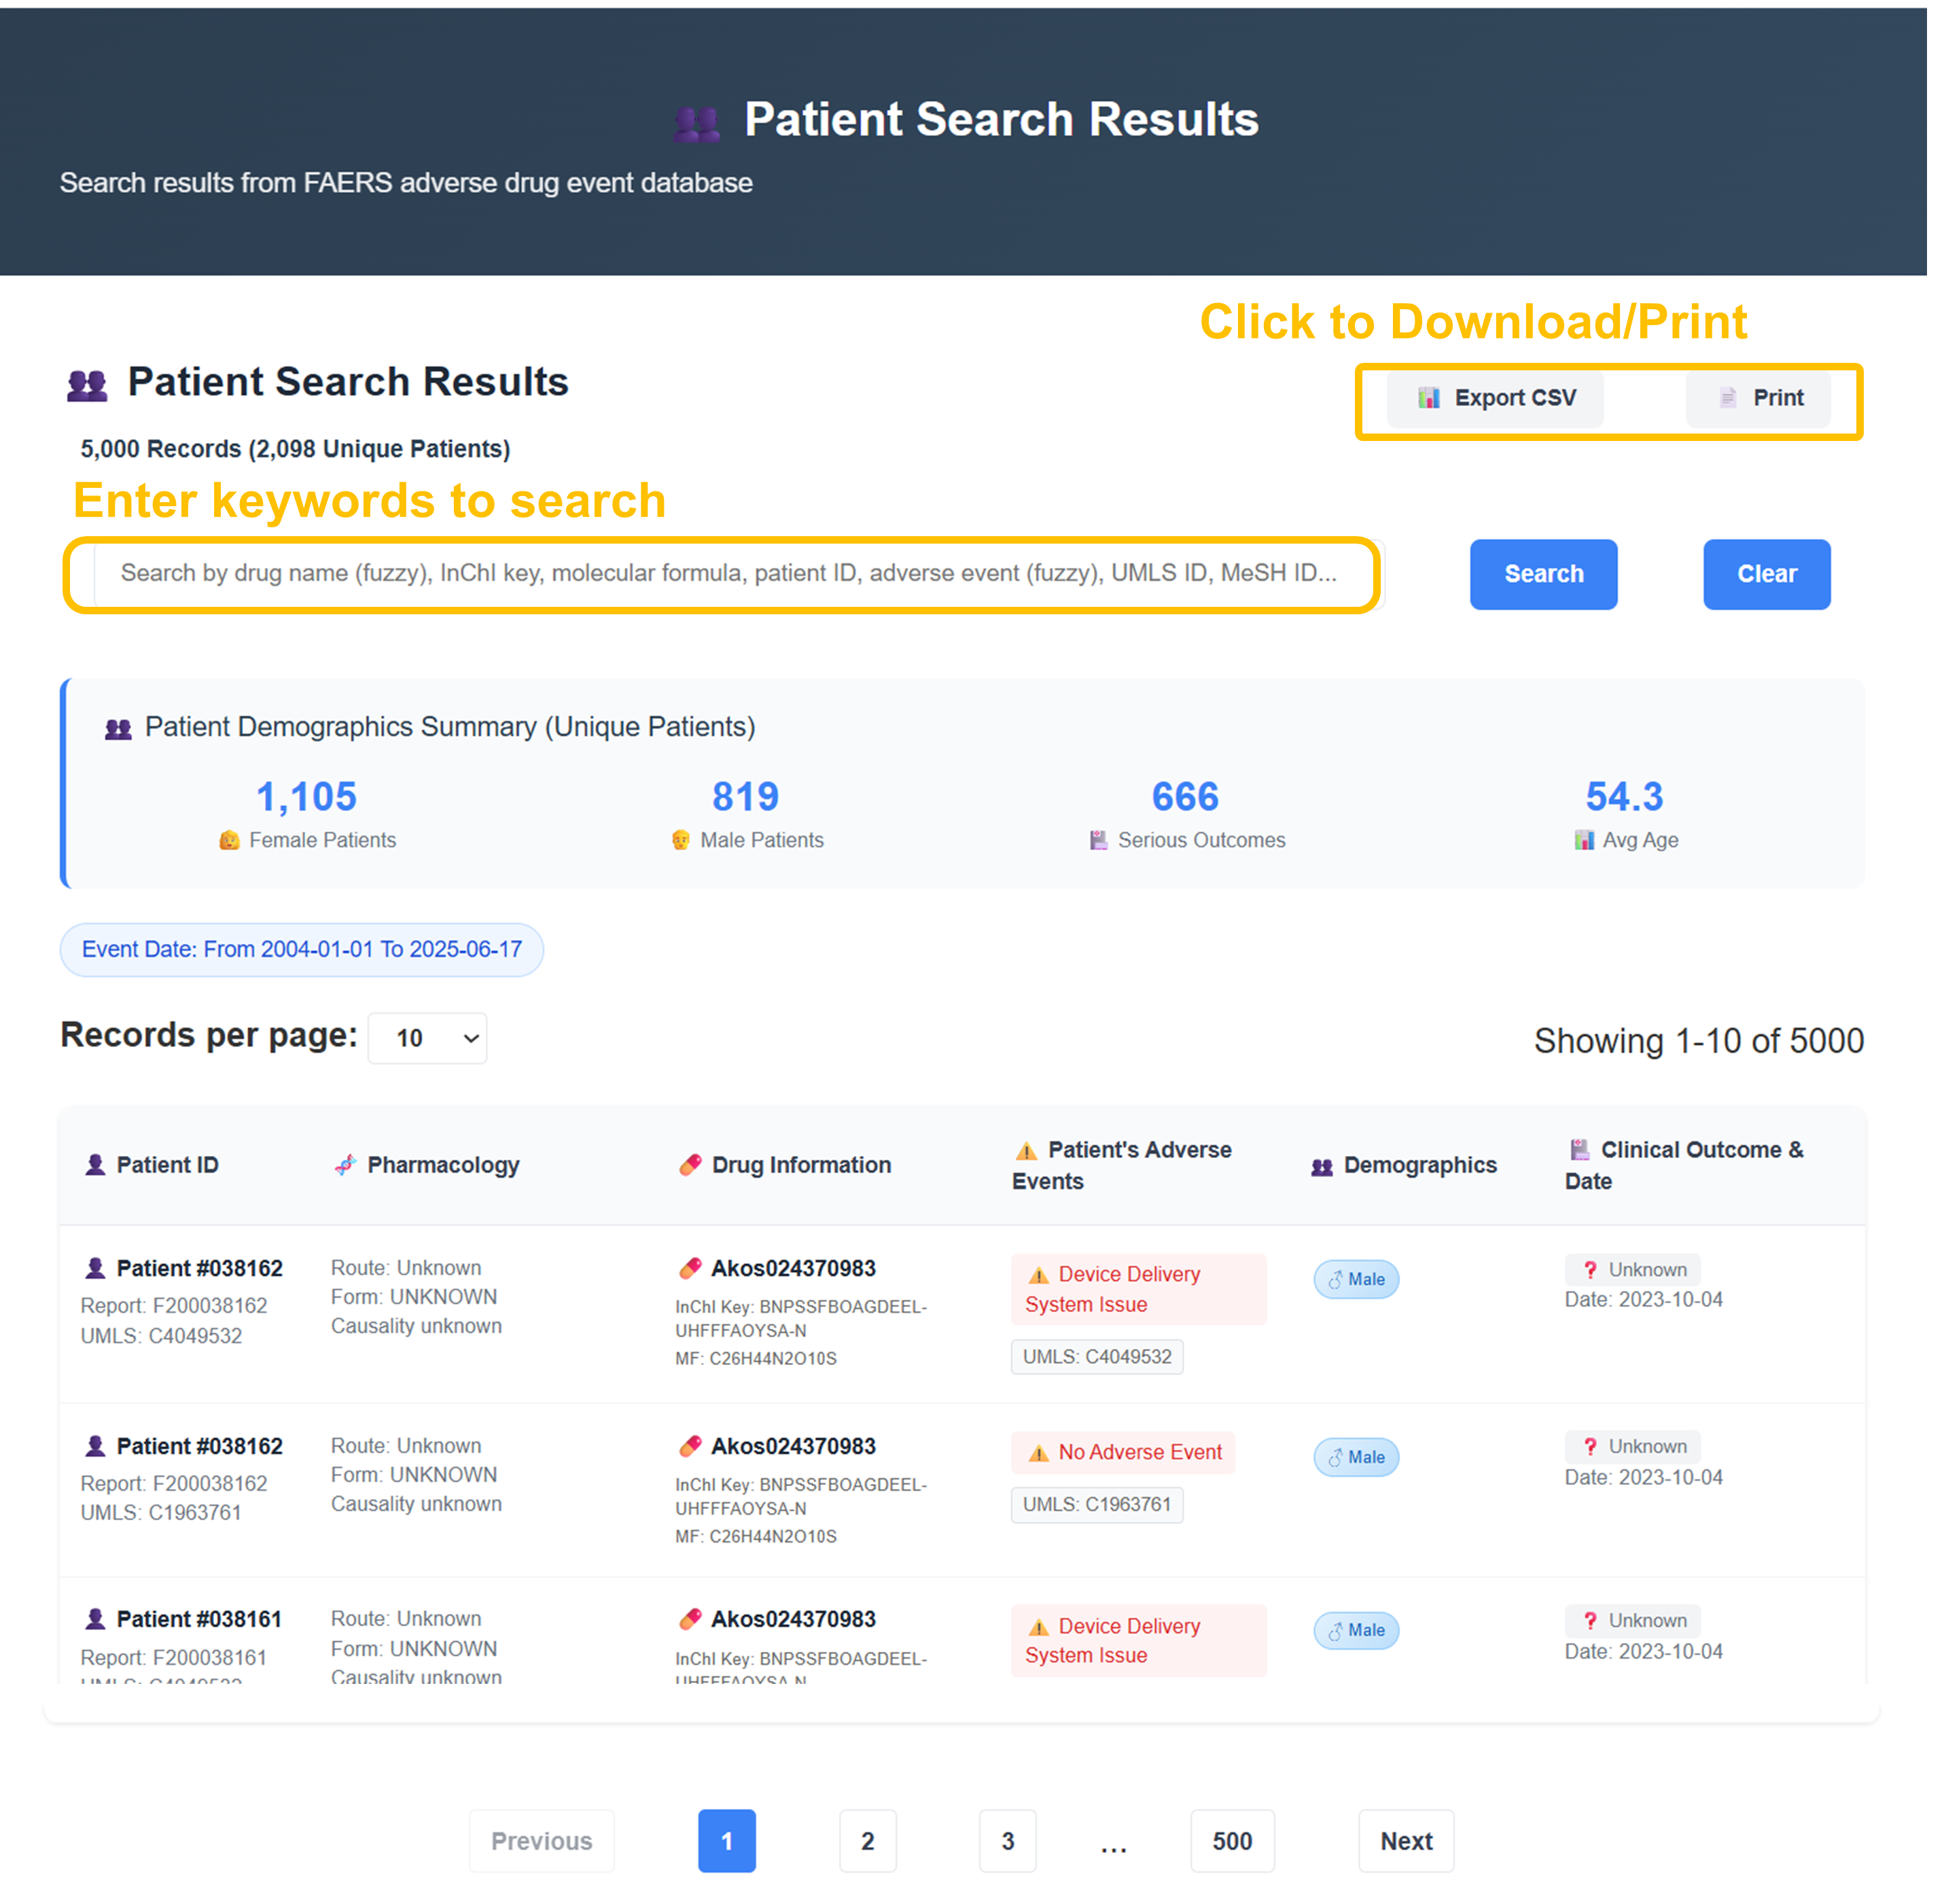
Analysis reveals 5,000 records from 2,098 unique patients with demographic breakdown: 1,105 Female, 819 Male, 666 serious outcomes, average age 54.3 years. Use search functionality by keywords, adjust records per page (10 options), and export results as CSV or print for further analysis.
🧪 Chemical Structure Similarity Search Walkthrough
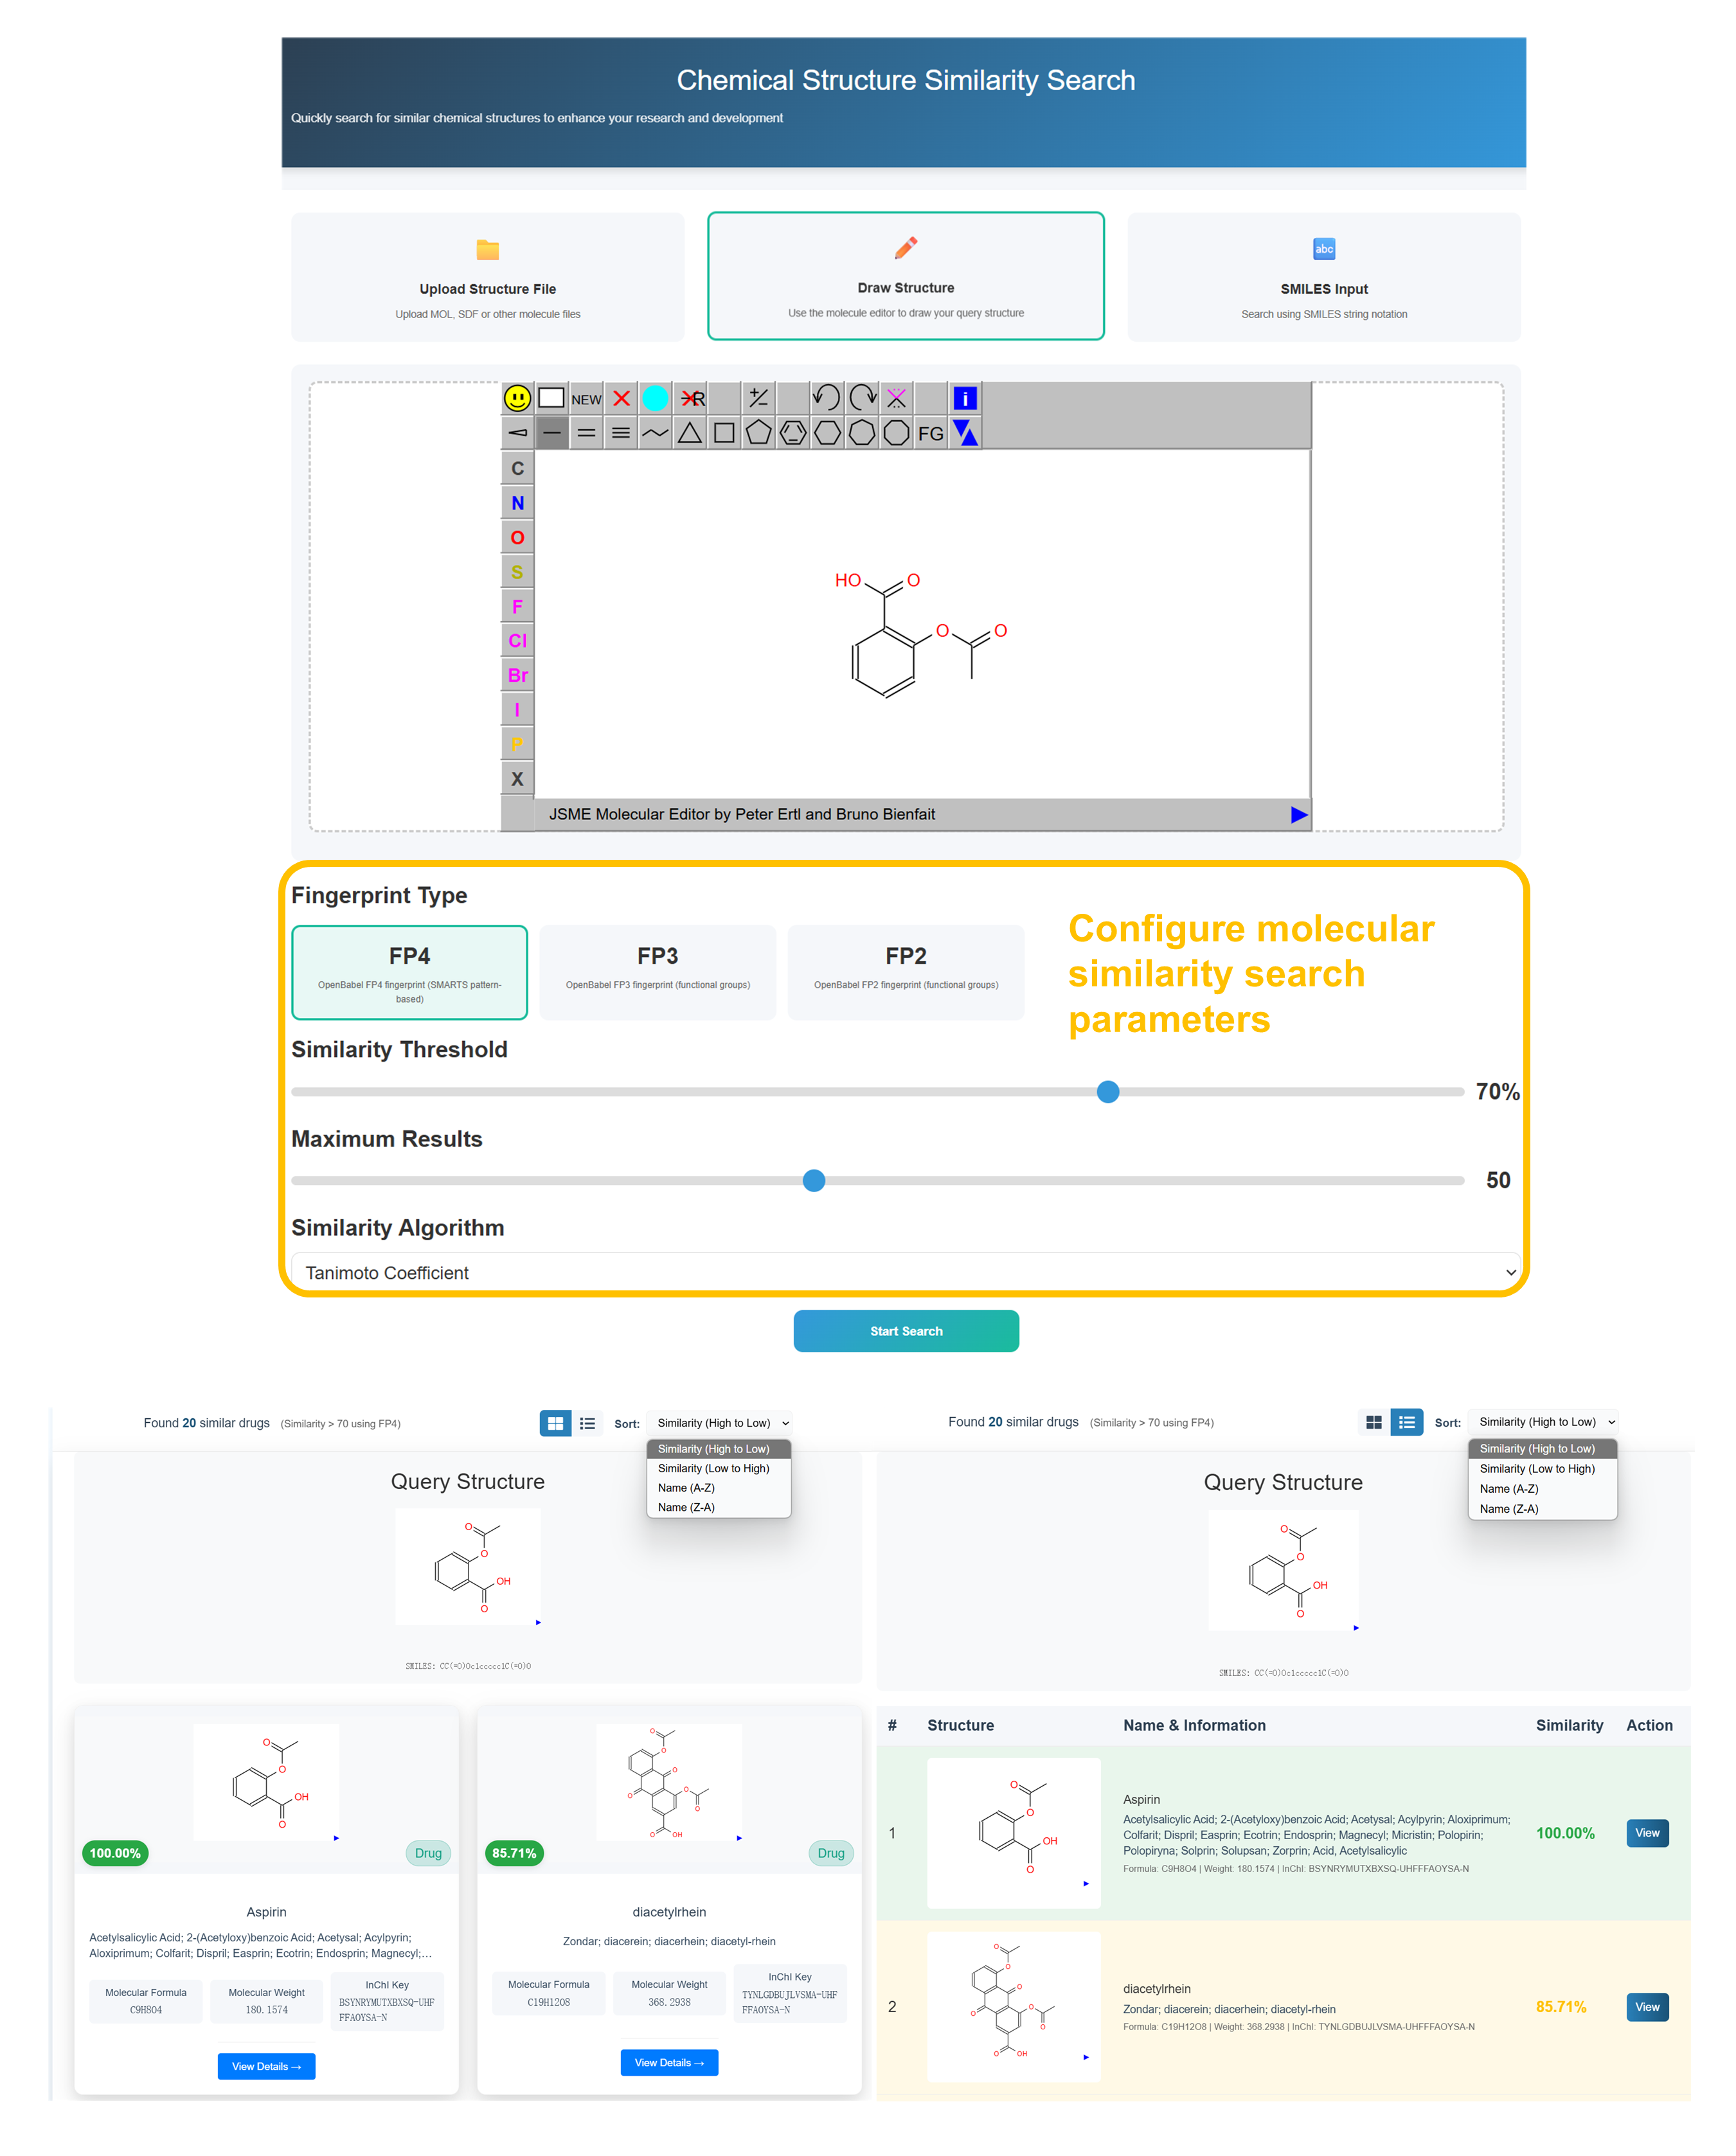
Choose Structure Input Method
Select "Upload Structure File" for MOL/SDF files, "Draw Structure" for JSME molecular editor (recommended), or "SMILES Input" for text-based molecular representation.
Draw or Input Molecular Structure
Use the JSME Molecular Editor to draw your target compound structure. Utilize the toolbar with atoms (C, N, O, S, P, F, Cl, Br, I), bonds, and structure editing tools to create accurate molecular representations.
Configure Similarity Parameters
Select Fingerprint Type (FP4 recommended), set Similarity Threshold (70% default), Maximum Results (50), and choose Tanimoto Coefficient algorithm for optimal molecular similarity scoring.
Review Similarity Results
Analyze found compounds with similarity percentages, molecular structures, drug names, and pharmaceutical information. Sort results by similarity (High to Low) and access detailed drug profiles.
🔤 Adverse Event Semantic Similarity Search Walkthrough
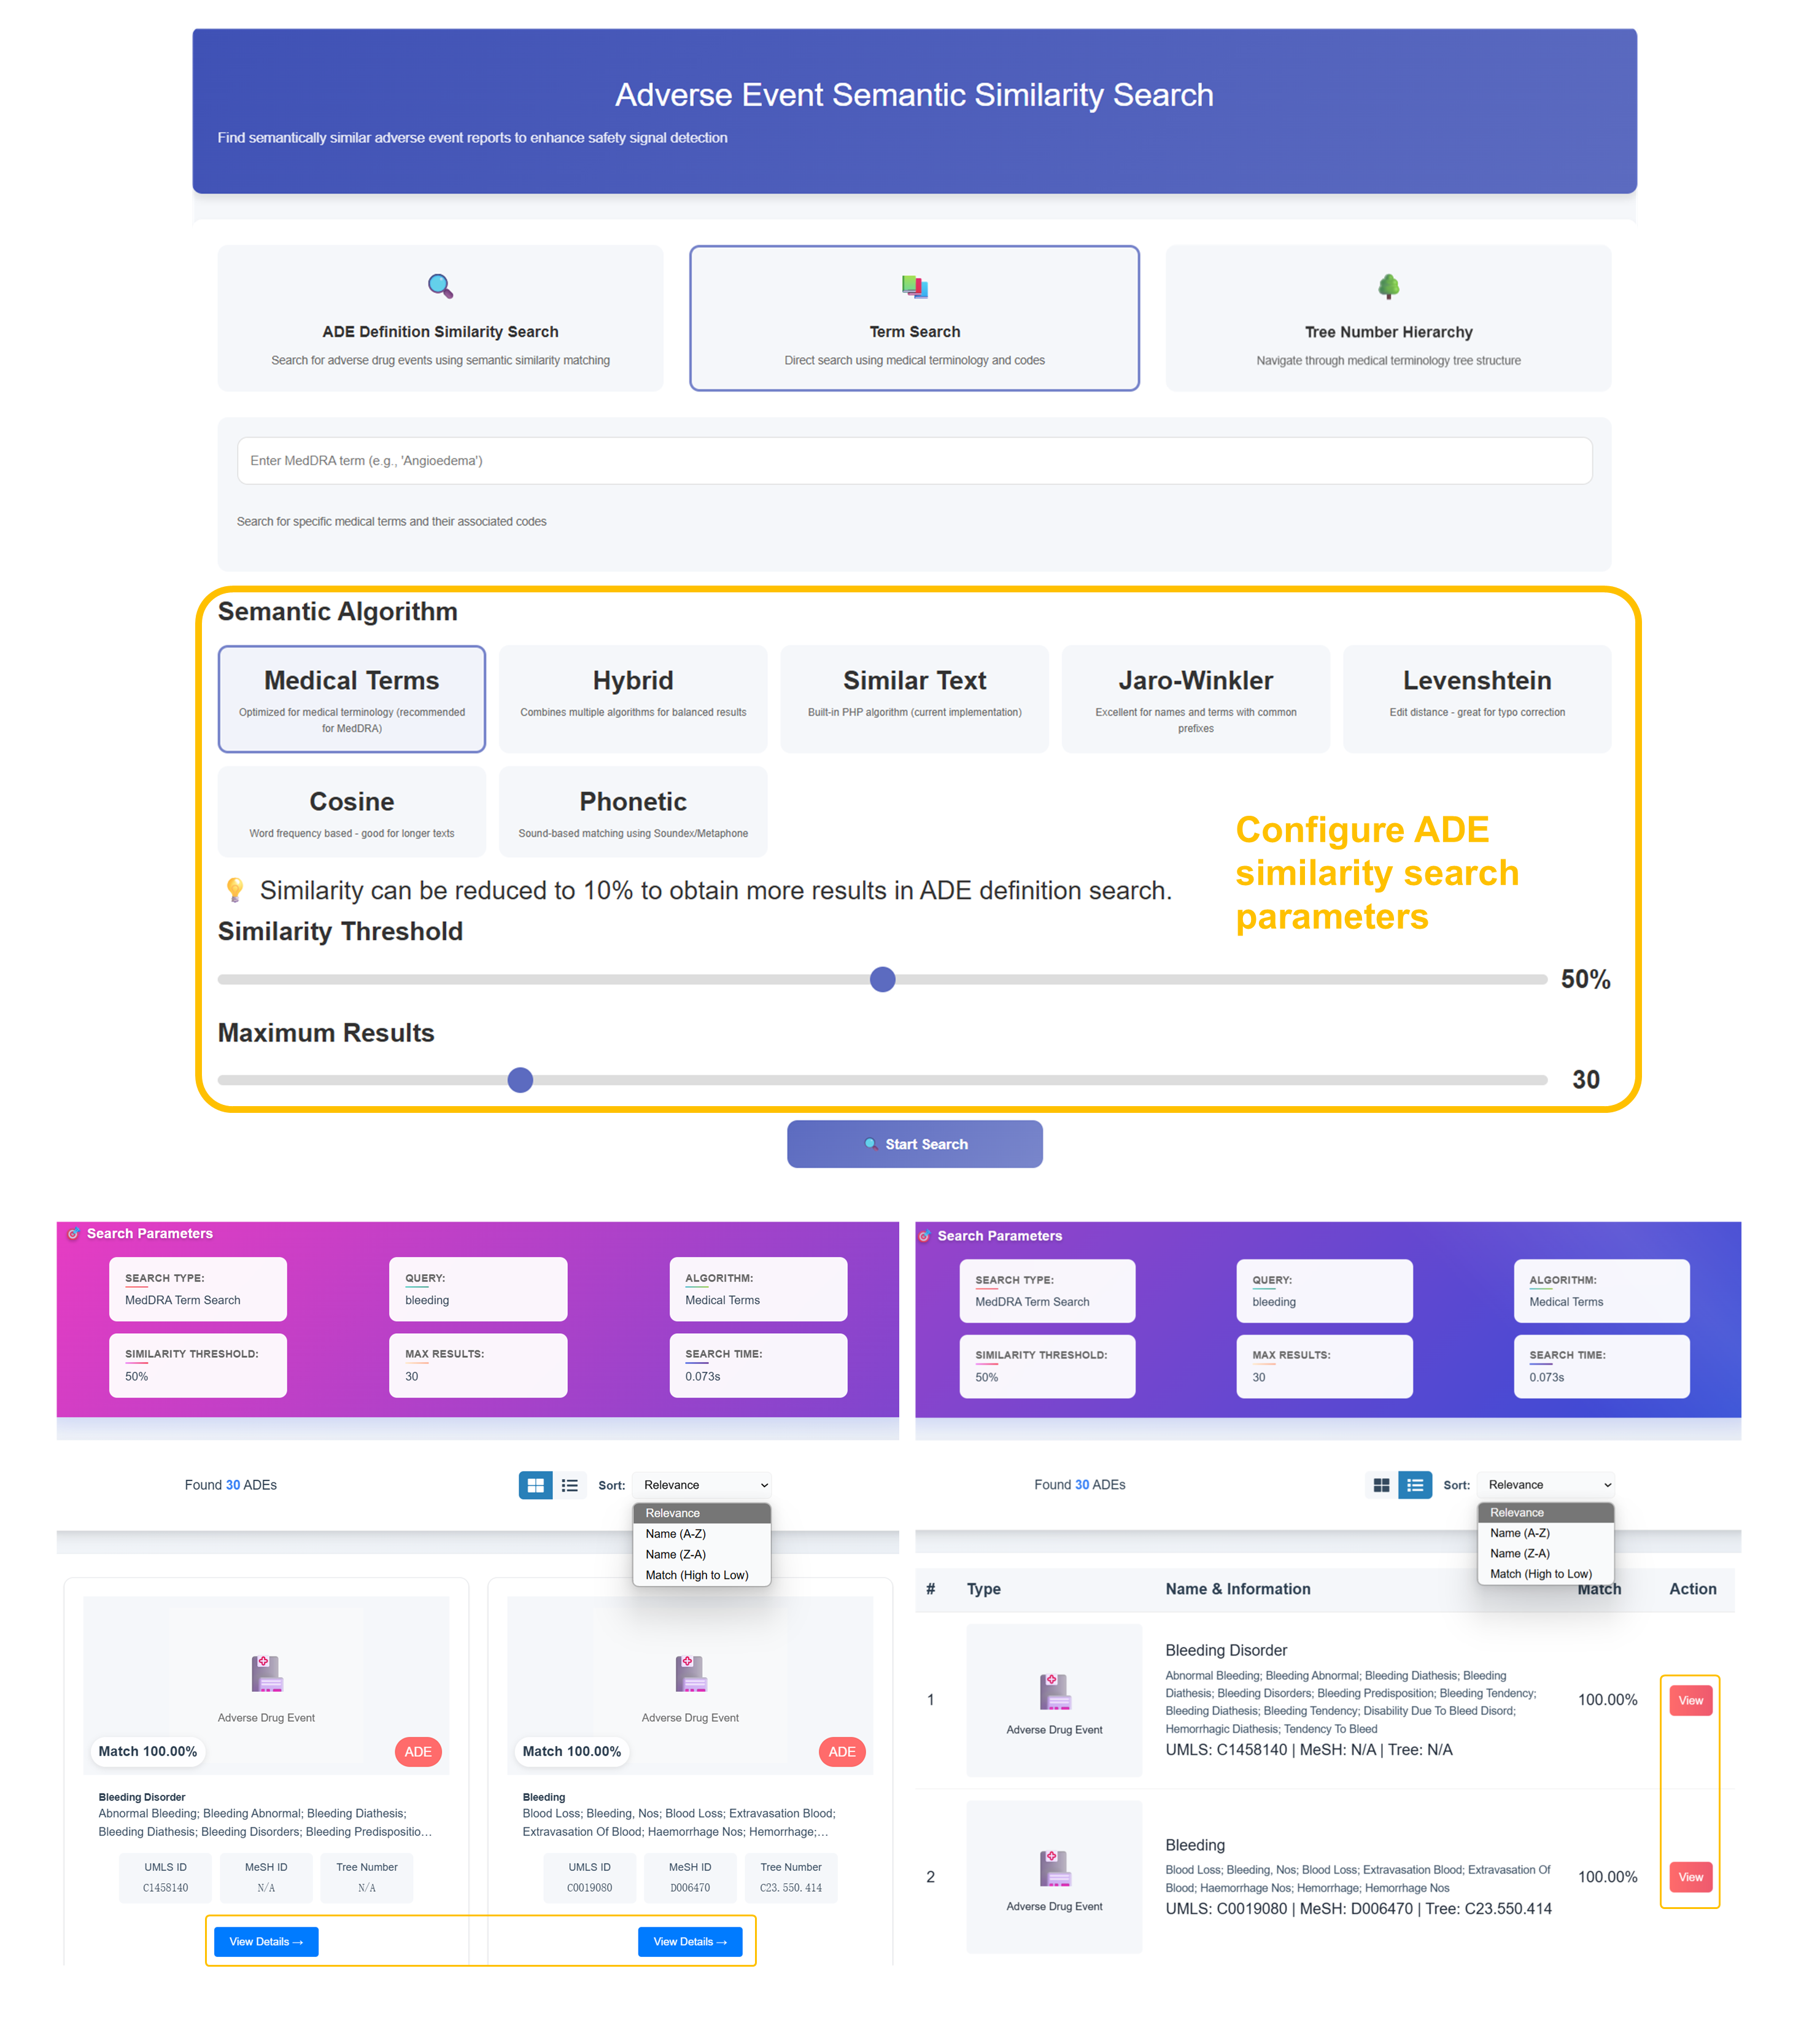
Select Semantic Search Mode
Choose "ADE Definition Similarity Search" for comprehensive matching, "Term Search" for direct medical terminology lookup (recommended), or "Tree Number Hierarchy" for structured medical classification navigation.
Configure Semantic Algorithm
Select from 7 algorithms: "Medical Terms" (recommended for MedDRA), "Hybrid", "Similar Text", "Jaro-Winkler", "Levenshtein", "Cosine", or "Phonetic". Adjust Similarity Threshold (50% default) and Maximum Results (30).
Enter Medical Terminology
Input MedDRA terms (e.g., "Bleeding", "Angioedema") in the search field. The system will search standardized medical terminology and associated codes for enhanced safety signal detection across adverse event databases.
Analyze Semantic Match Results
Review similarity percentages, ADE types, names & information, and match scores. Sort by Relevance, Name (A-Z, Z-A), or Match (High to Low). Access detailed ADE profiles with UMLS IDs, MeSH IDs, and Tree Numbers.
Patient Search Results
- 5,000 records from 2,098 unique patients analyzed
- Comprehensive demographic breakdown by gender and age
- 666 serious outcomes with detailed clinical assessments
- Advanced filtering by demographics and clinical criteria
- Export capabilities with CSV download and print options
Chemical Similarity Results
- Found 20 similar drugs with precise molecular matching
- Aspirin (100.00% match) and diaceylrhein (82.71% similarity)
- Detailed molecular structures with formula and weight data
- Tanimoto coefficient scoring with 70% threshold
- Interactive molecular viewer with comprehensive drug profiles
Semantic ADE Results
- Found 30 ADEs with advanced semantic matching algorithms
- Bleeding Disorder (100.00% match) with related conditions
- Comprehensive medical terminology integration
- UMLS IDs, MeSH IDs, and Tree Number classifications
- Enhanced safety signal detection across medical databases
💊 Drug Information
Comprehensive pharmaceutical data and evidence-based safety profiles
💊 Drug Profile - Basic Information
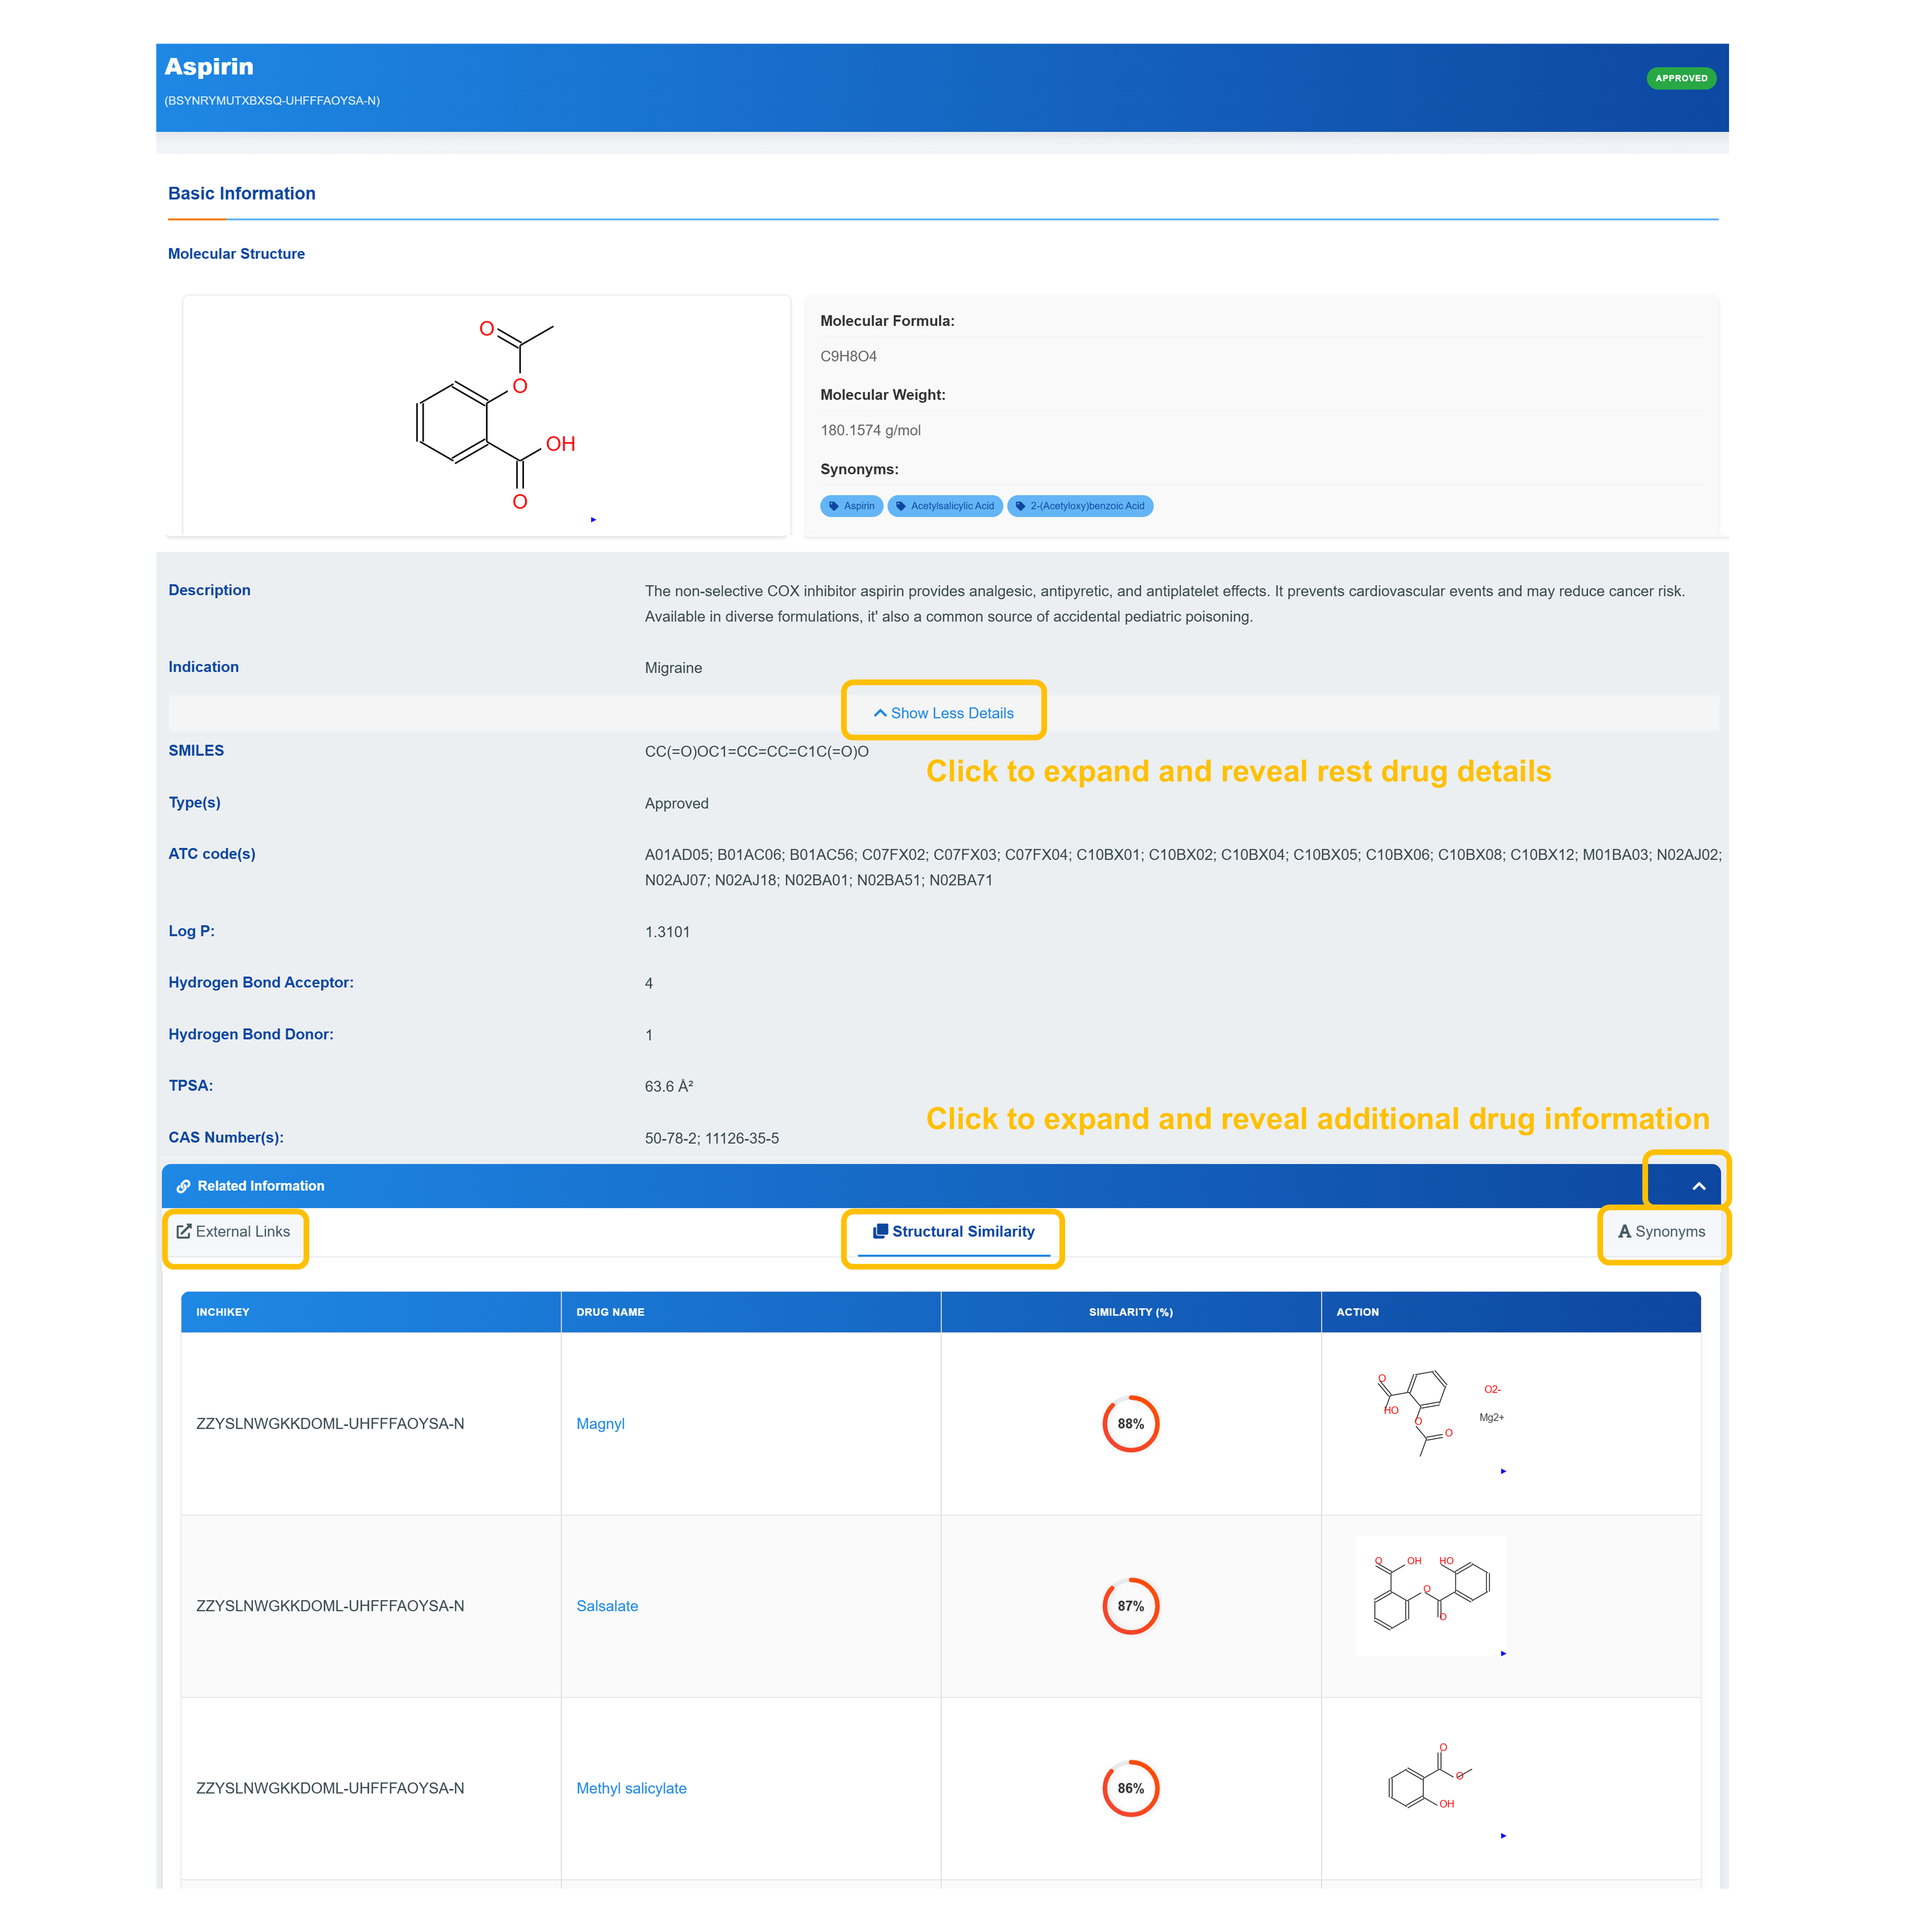
Access Drug Basic Information
VDisplay molecular formula, molecular weight, and synonyms along with approval status indicators.
Explore Chemical Properties
Examine SMILES notation, ATC codes, TPSA values, and detailed pharmaceutical identifiers including CAS numbers and chemical descriptors.
Access Extended Information
Click "Show Less Details" to expand sections revealing complete drug information including indication data, structural similarity analysis, and external links to comprehensive databases.
Review Structural Similarity
Analyze chemical similarity with related compounds with detailed molecular structures and similarity scores.
🔗 Drug-Target-ADE Network Analysis
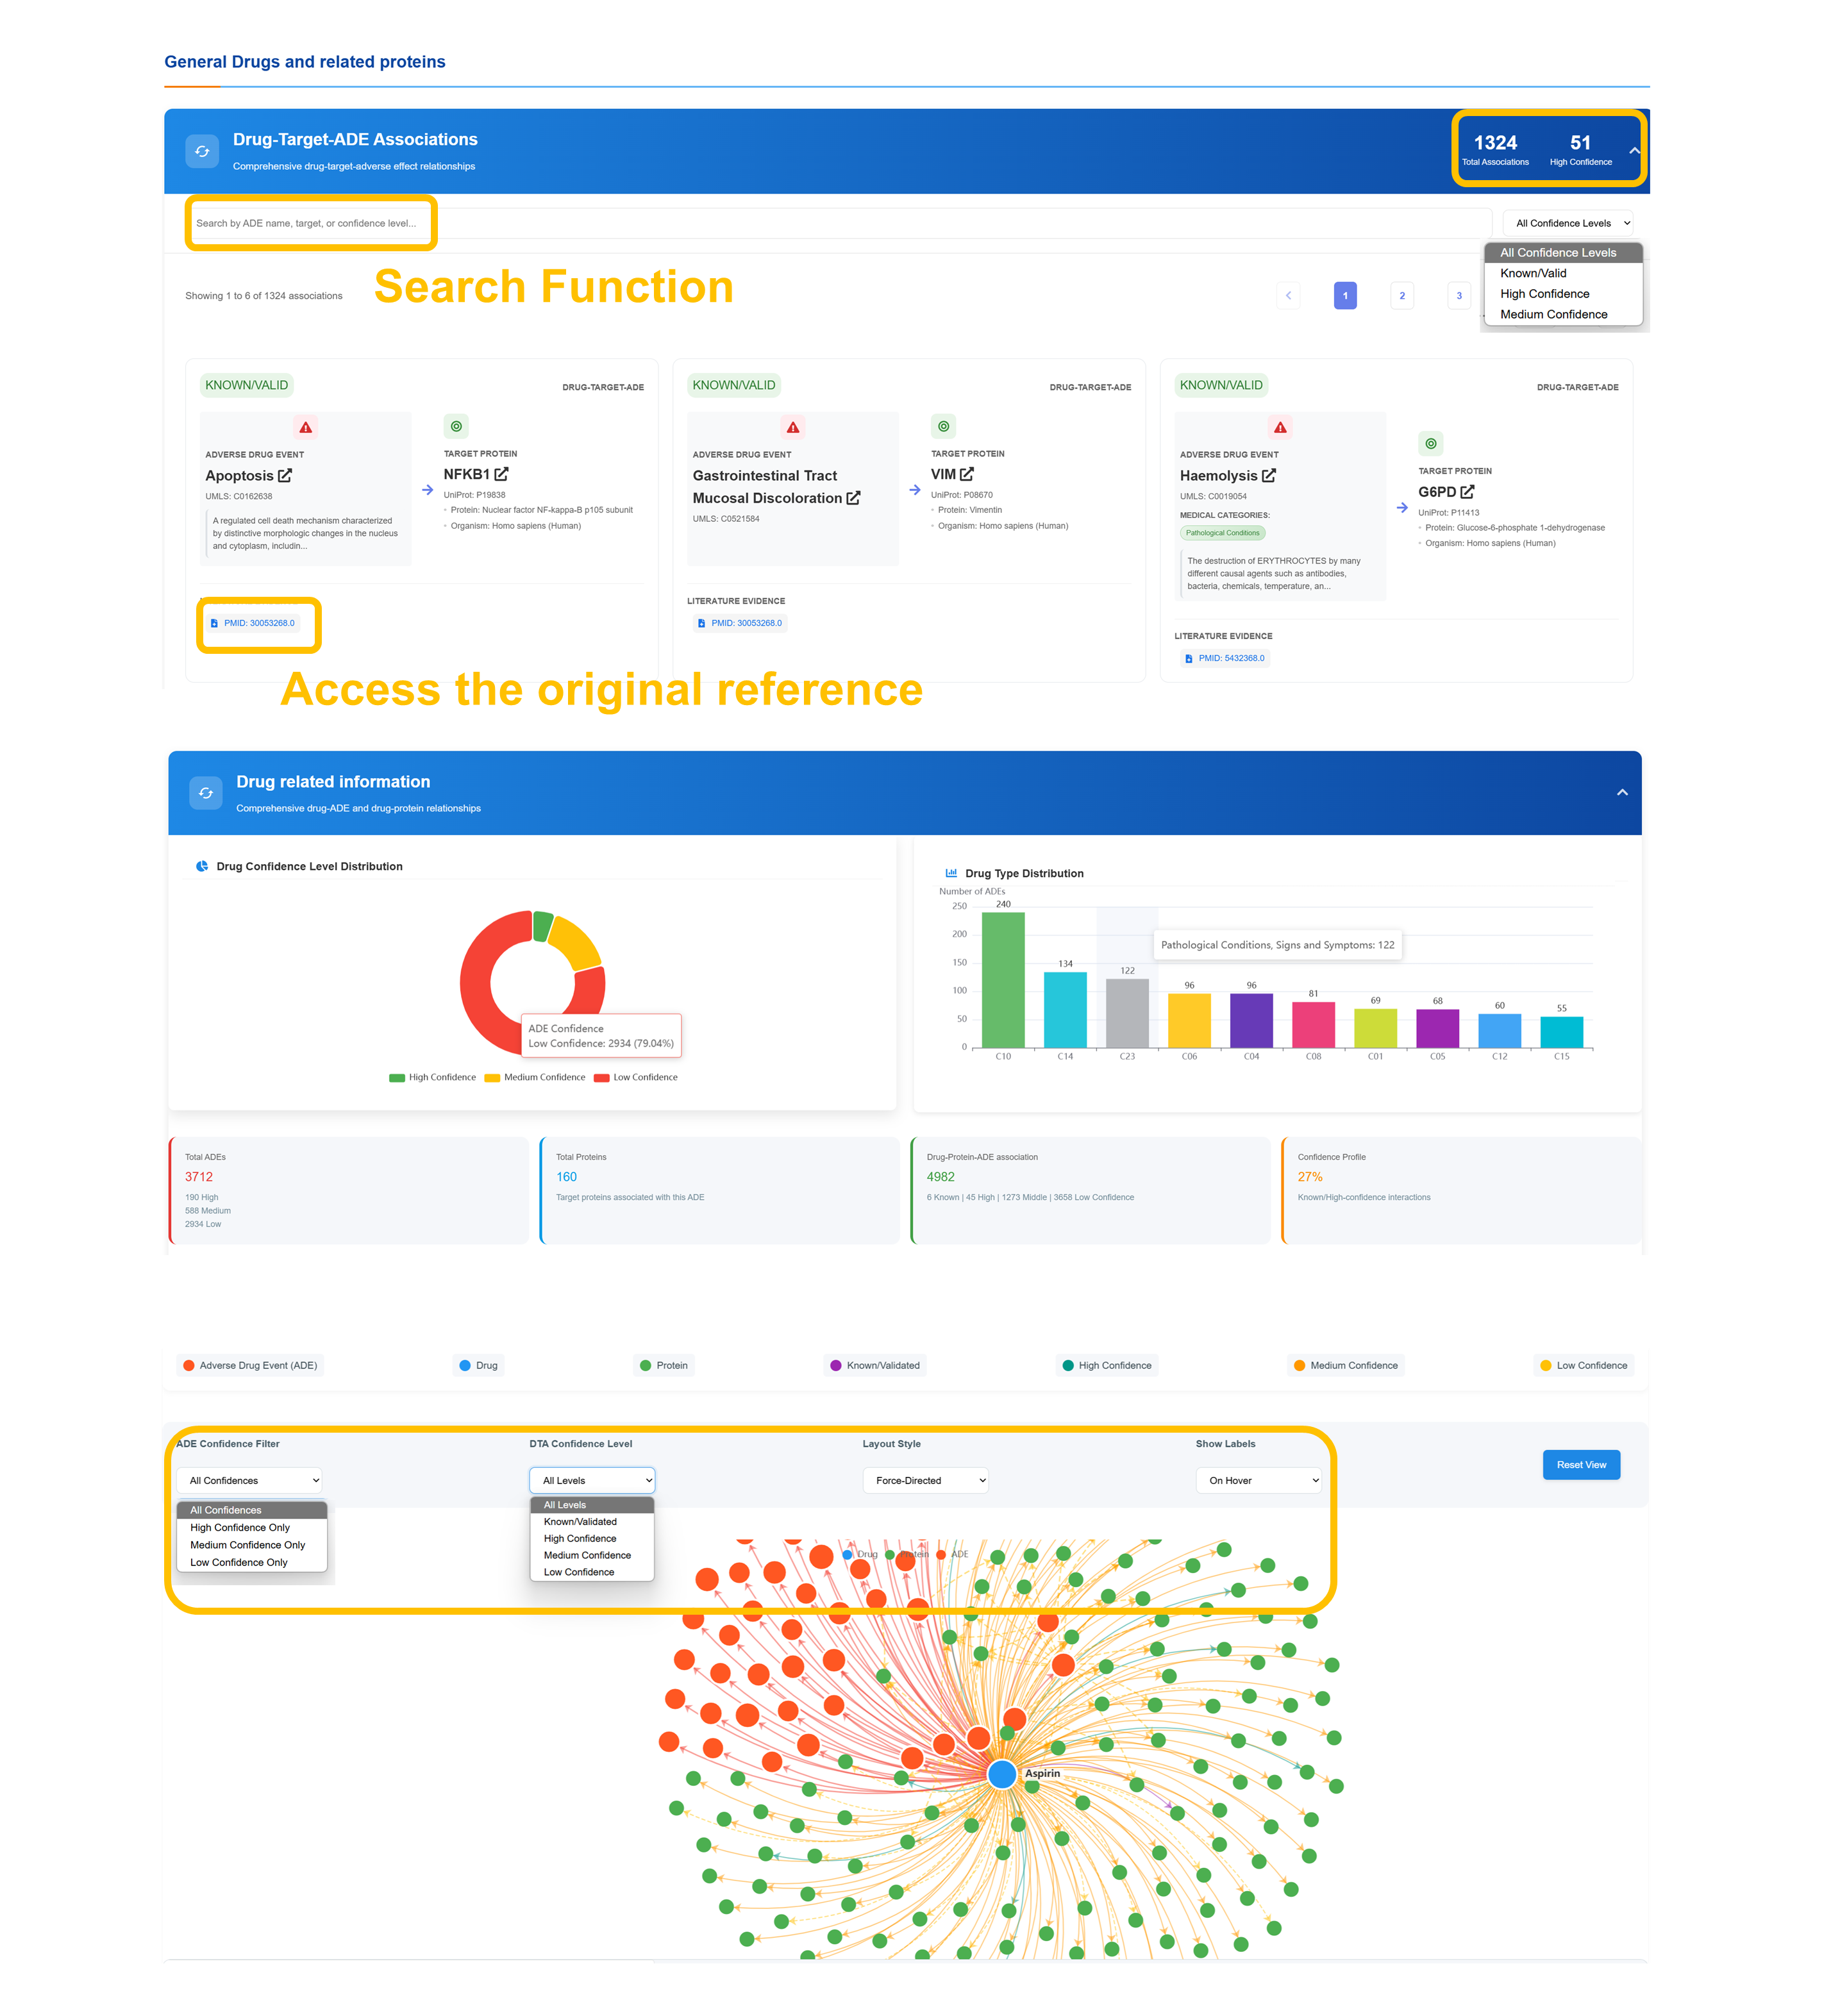
Comprehensive drug–target–ADE relationship data with filtering by total associations and confidence tiers. Users can search by drug, target, or confidence level, view linked literature citations for validation, and explore the results through an interactive network visualization.
⚠️ ADE Center - Adverse Event Analysis
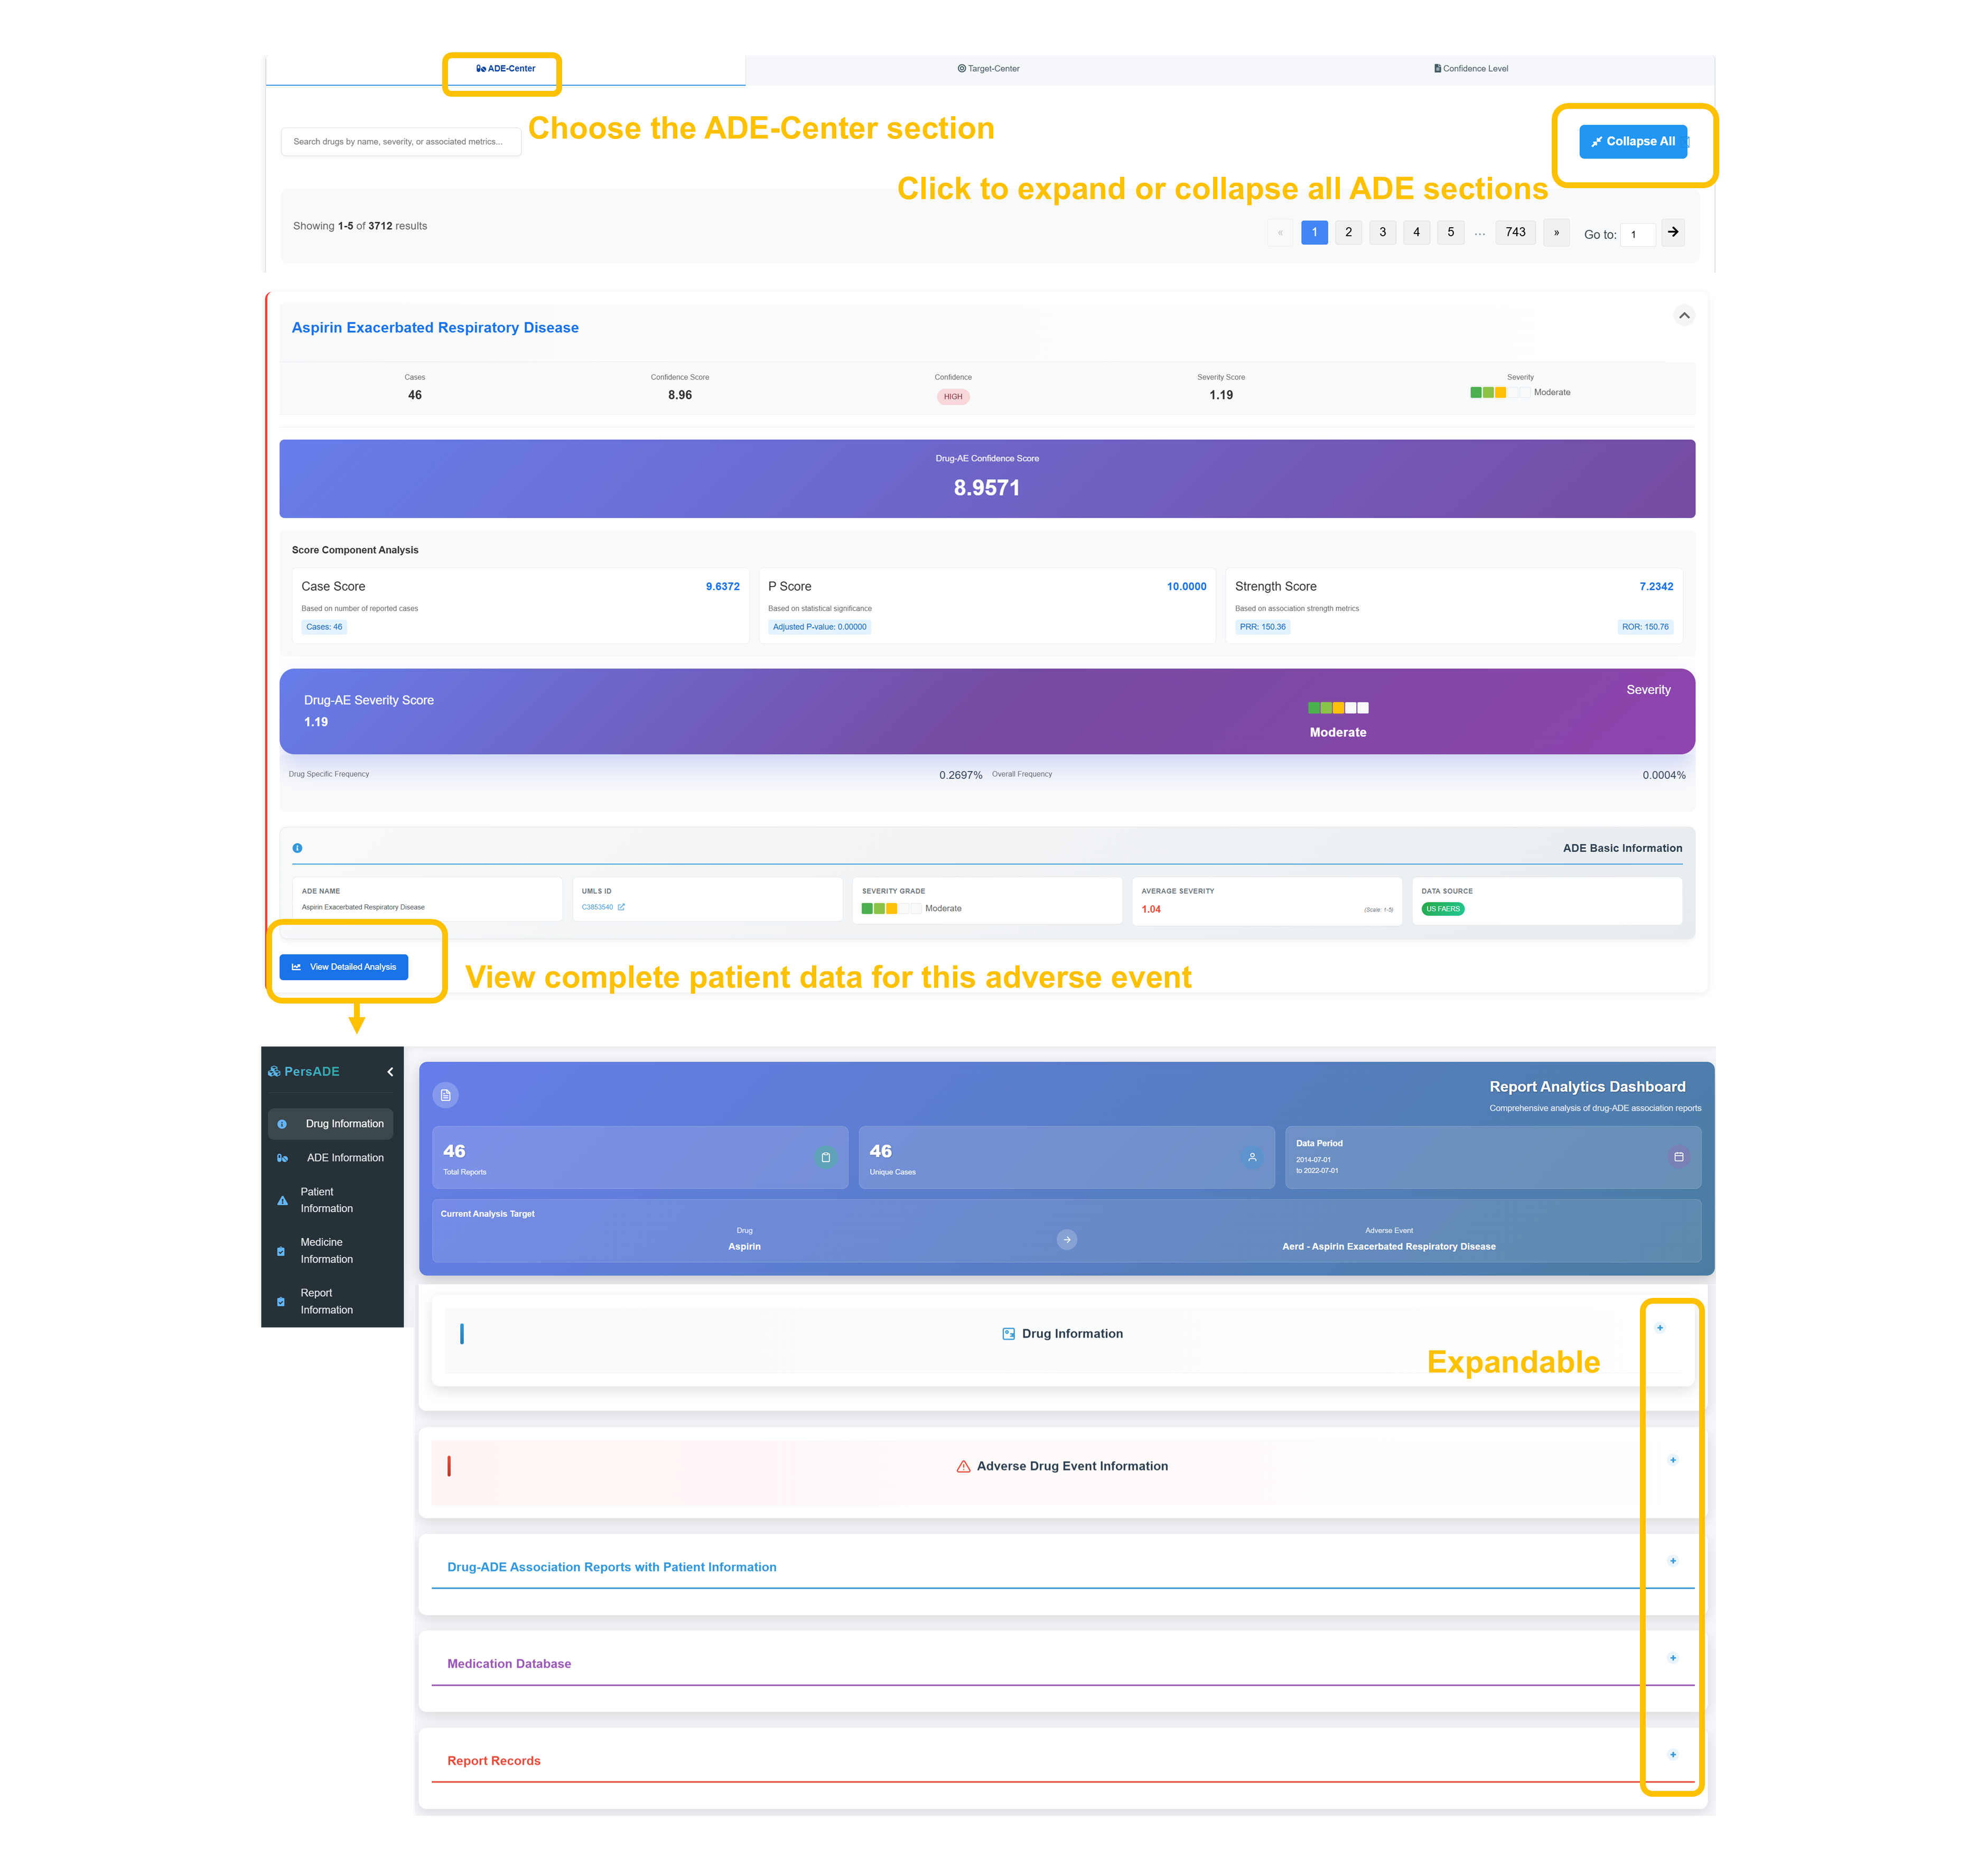
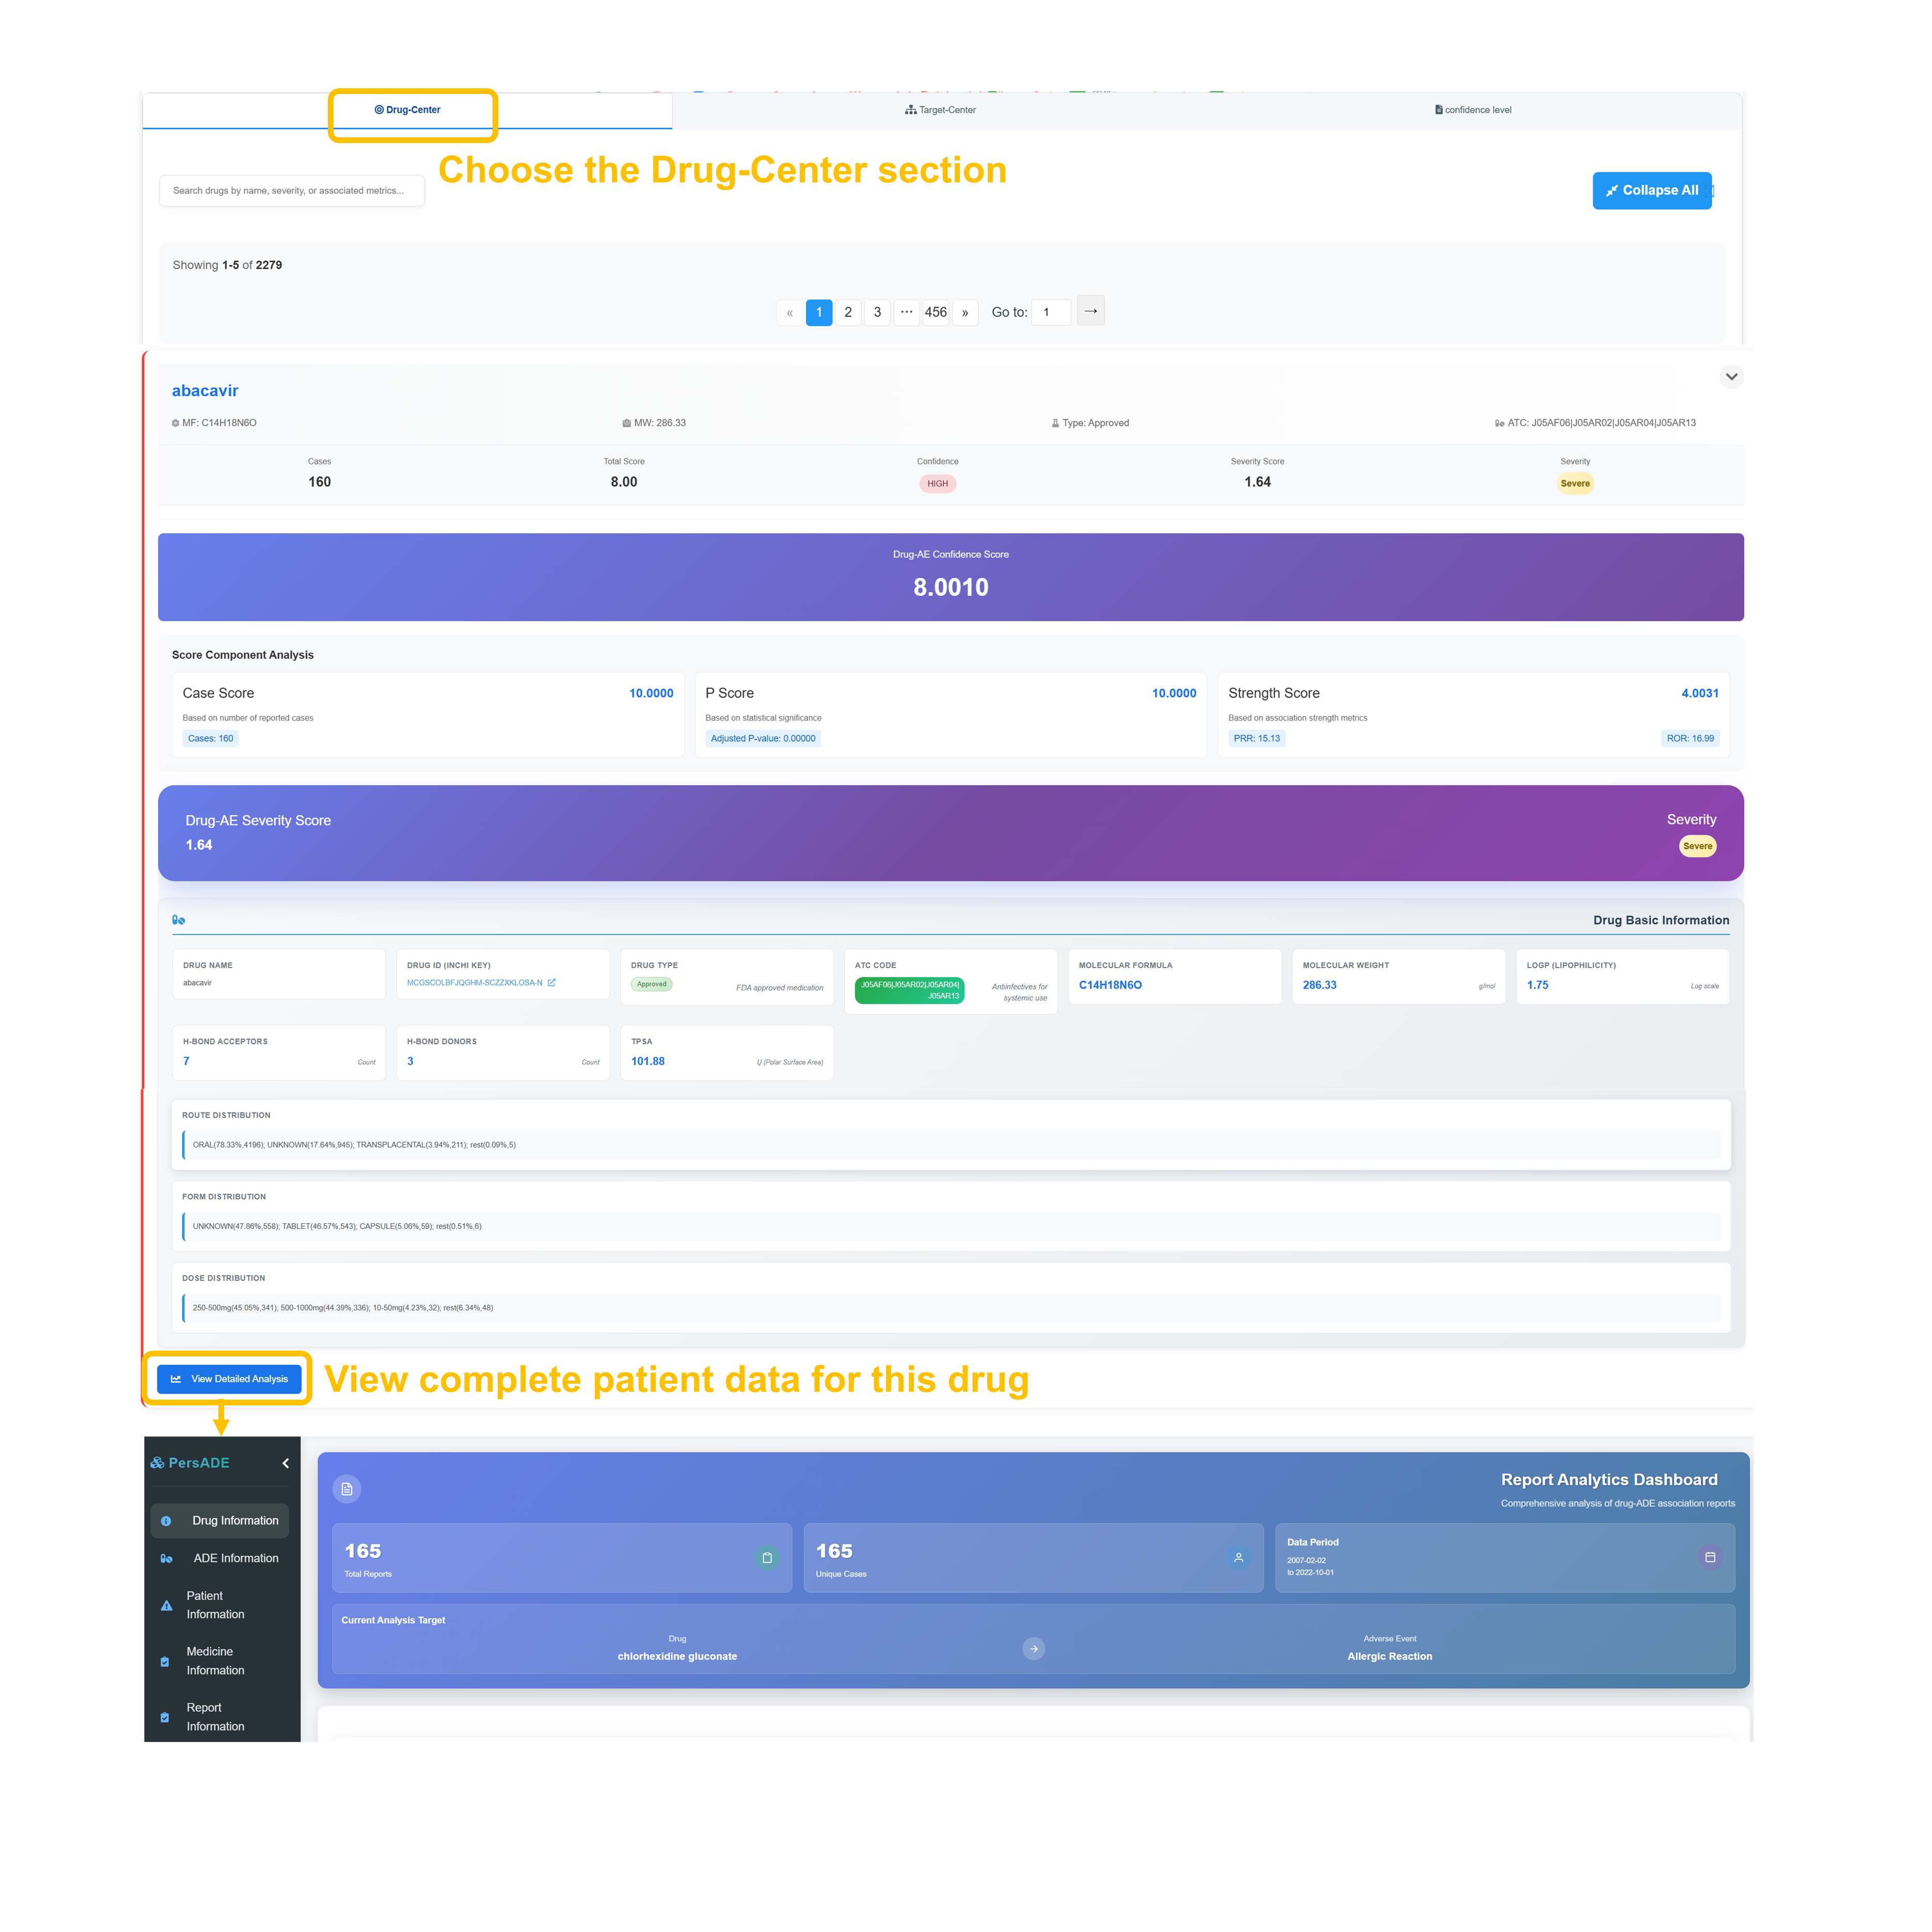
Navigate to ADE Center Section
Select the "ADE Center" tab to access comprehensive adverse event analysis. Use the “Collapse All” feature to expand or collapse content sections and navigate large result sets with pagination controls.
Analyze ADE Scoring Metrics
Review detailed scoring: Cases, Confidence Score, P Score, Severity Score, with overall Drug-AE Confidence Score of all indicating high confidence relationship.
Examine Severity Assessment
Assess the Drug–ADE severity score alongside its severity classification and report both drug-specific and overall occurrence frequencies.
Access Patient Data Analysis
Click "View Detailed Analysis" to access complete patient data for this adverse event, including demographic breakdowns, temporal patterns, and clinical outcome assessments.
🎯 Target Center - Protein Target Analysis
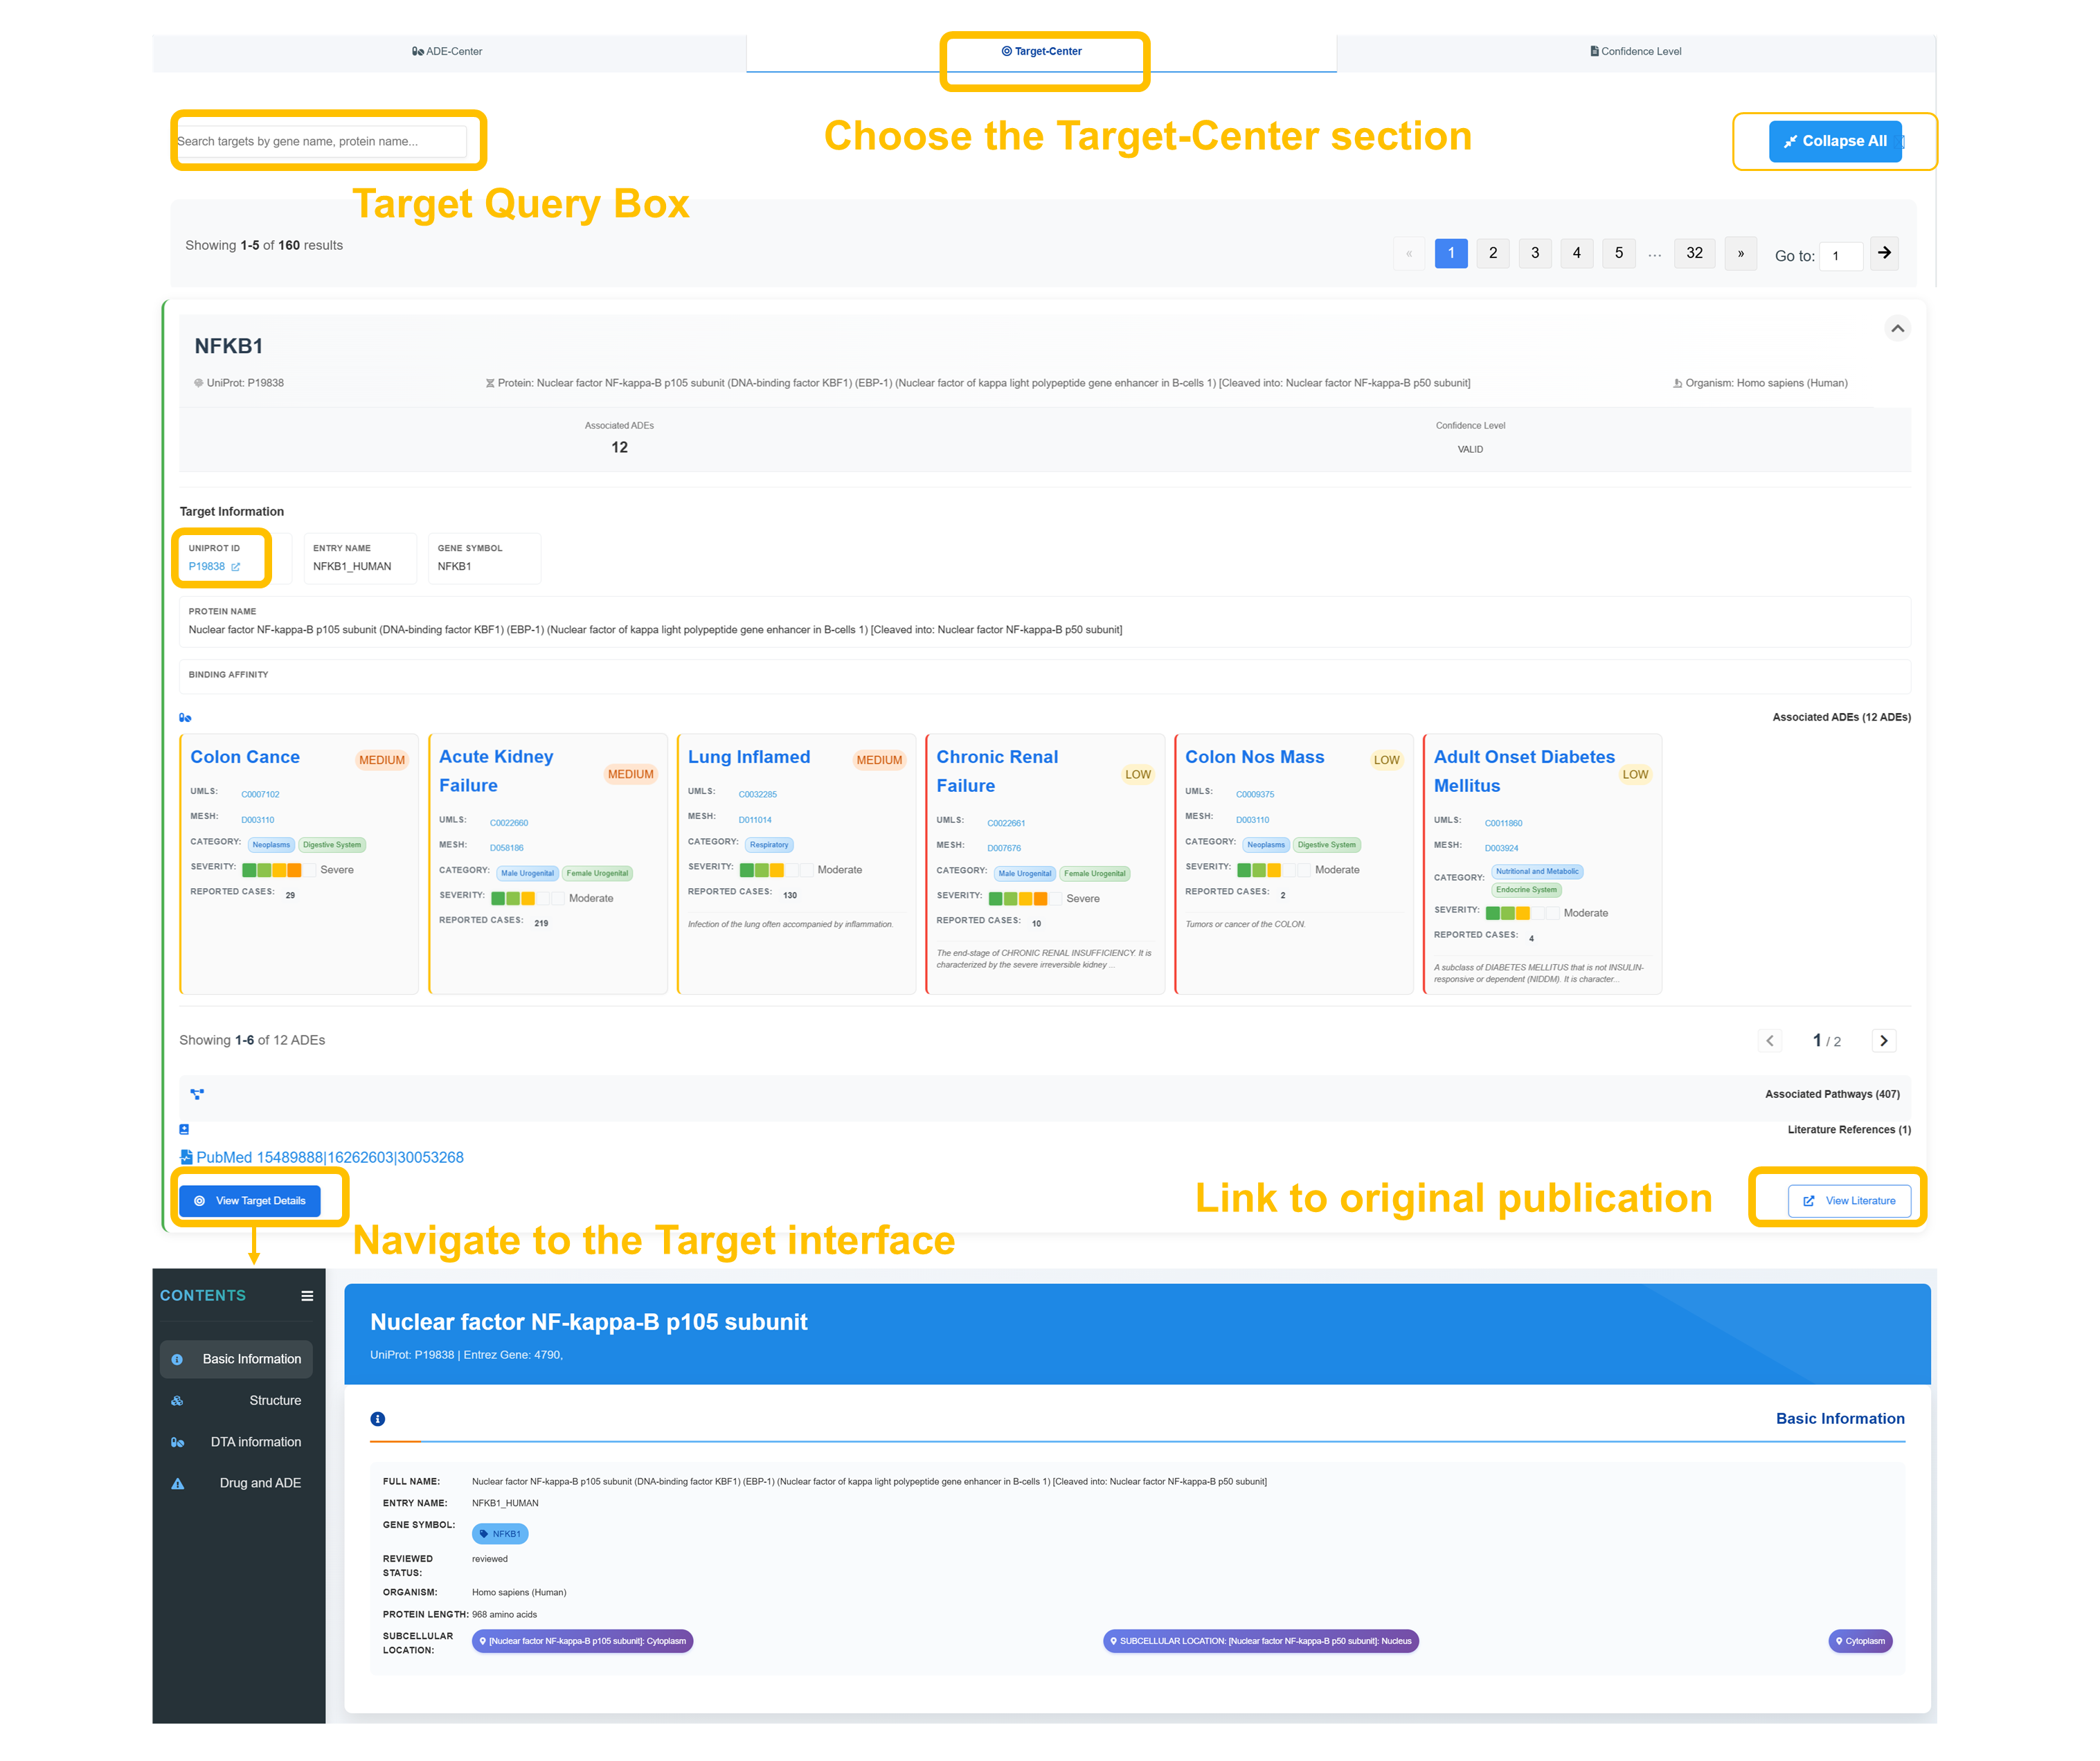
Navigate to Target Center
Choose "Target Center" section and use the target query box to search by gene name, protein name, or UniProt ID. Example search: NFKB1 shows 12 associated ADEs with WILD confidence level.
Review Target Information
Retrieve detailed protein information—including the protein name, UniProt ID, and gene symbol—along with binding affinity data and functional annotations.
Analyze Associated ADEs
Review associated adverse events with their respective confidence levels and severity classifications.
Access Literature References
Click "View Target Details" to access complete target interface with literature references, pathway information, and structural data for comprehensive target analysis.
📊 Confidence Level Grading System
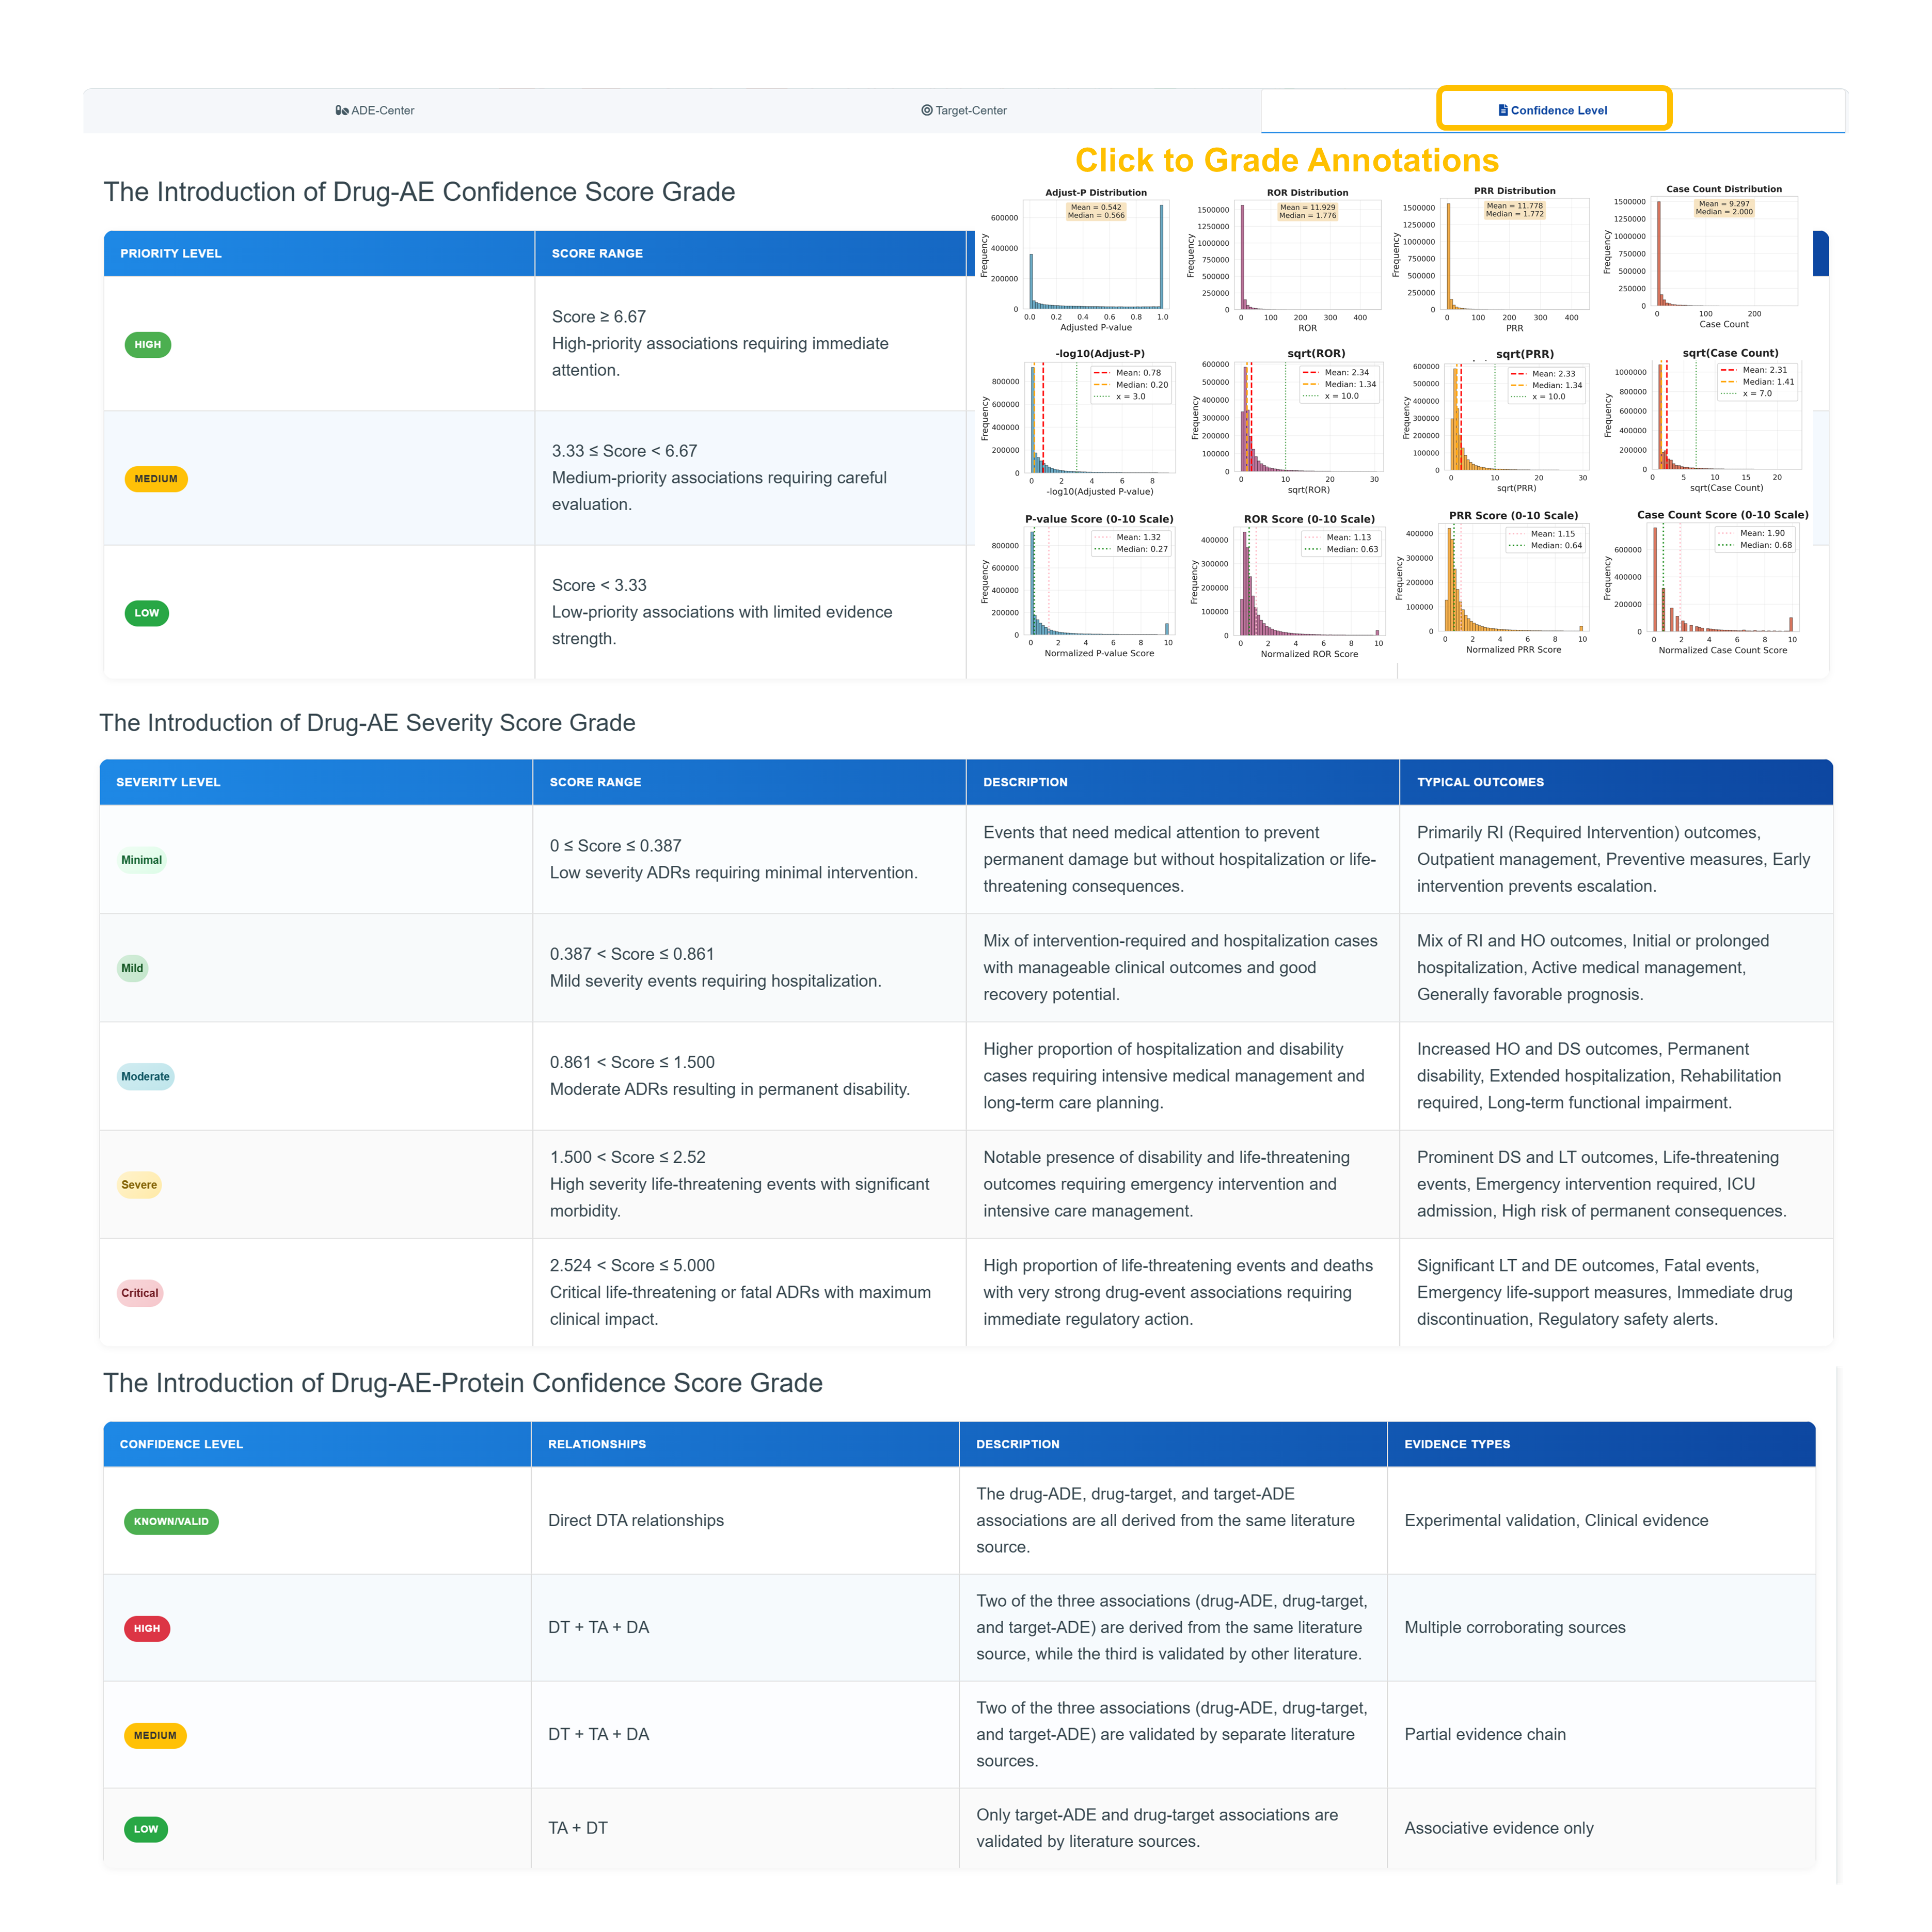
Understand Drug-AE Confidence Score Grades
Review the three-tier confidence system: HIGH (Score ≥ 6.67) for high-priority associations requiring immediate attention, MEDIUM (3.33 ≤ Score < 6.67) for medium-priority associations requiring careful evaluation, and LOW (Score < 3.33) for low-priority associations with limited evidence strength.
Analyze Severity Score Classifications
Examine five severity levels from Minimal (0 ≤ Score ≤ 0.387) requiring minimal intervention to Critical (2.524 ≤ Score ≤ 5.000) for life-threatening events with maximum clinical impact. Each level includes detailed outcome descriptions and typical clinical consequences.
Review Drug-AE-Protein Confidence Levels
Understand four confidence categories: KNOWN/VALID for direct DTA relationships with experimental validation, HIGH for multiple corroborating sources (DT + TA + DA), MEDIUM for partial evidence chains, and LOW for associative evidence only (TA + DT).
Access Grade Annotation Interface
Click "Grade Annotations" to view statistical distributions across Adjust-P, ROR, PRR, and Case Count parameters with detailed histogram visualizations showing score distributions and median values for comprehensive confidence assessment.
📊 Drug Route & Form Analysis Dashboard
Interactive analysis dashboard presenting distributions of administration routes and dosage forms via visualizations; detailed route analysis with reaction metrics, case ratios, confidence tiers, and severity scores; CSV export capability; and seamless navigation through the patient data interface with overall report counts and current analysis context.
⚠️ ADE Information
Standardized adverse event classification and clinical severity assessment
⚠️ADE Profile - Basic Information
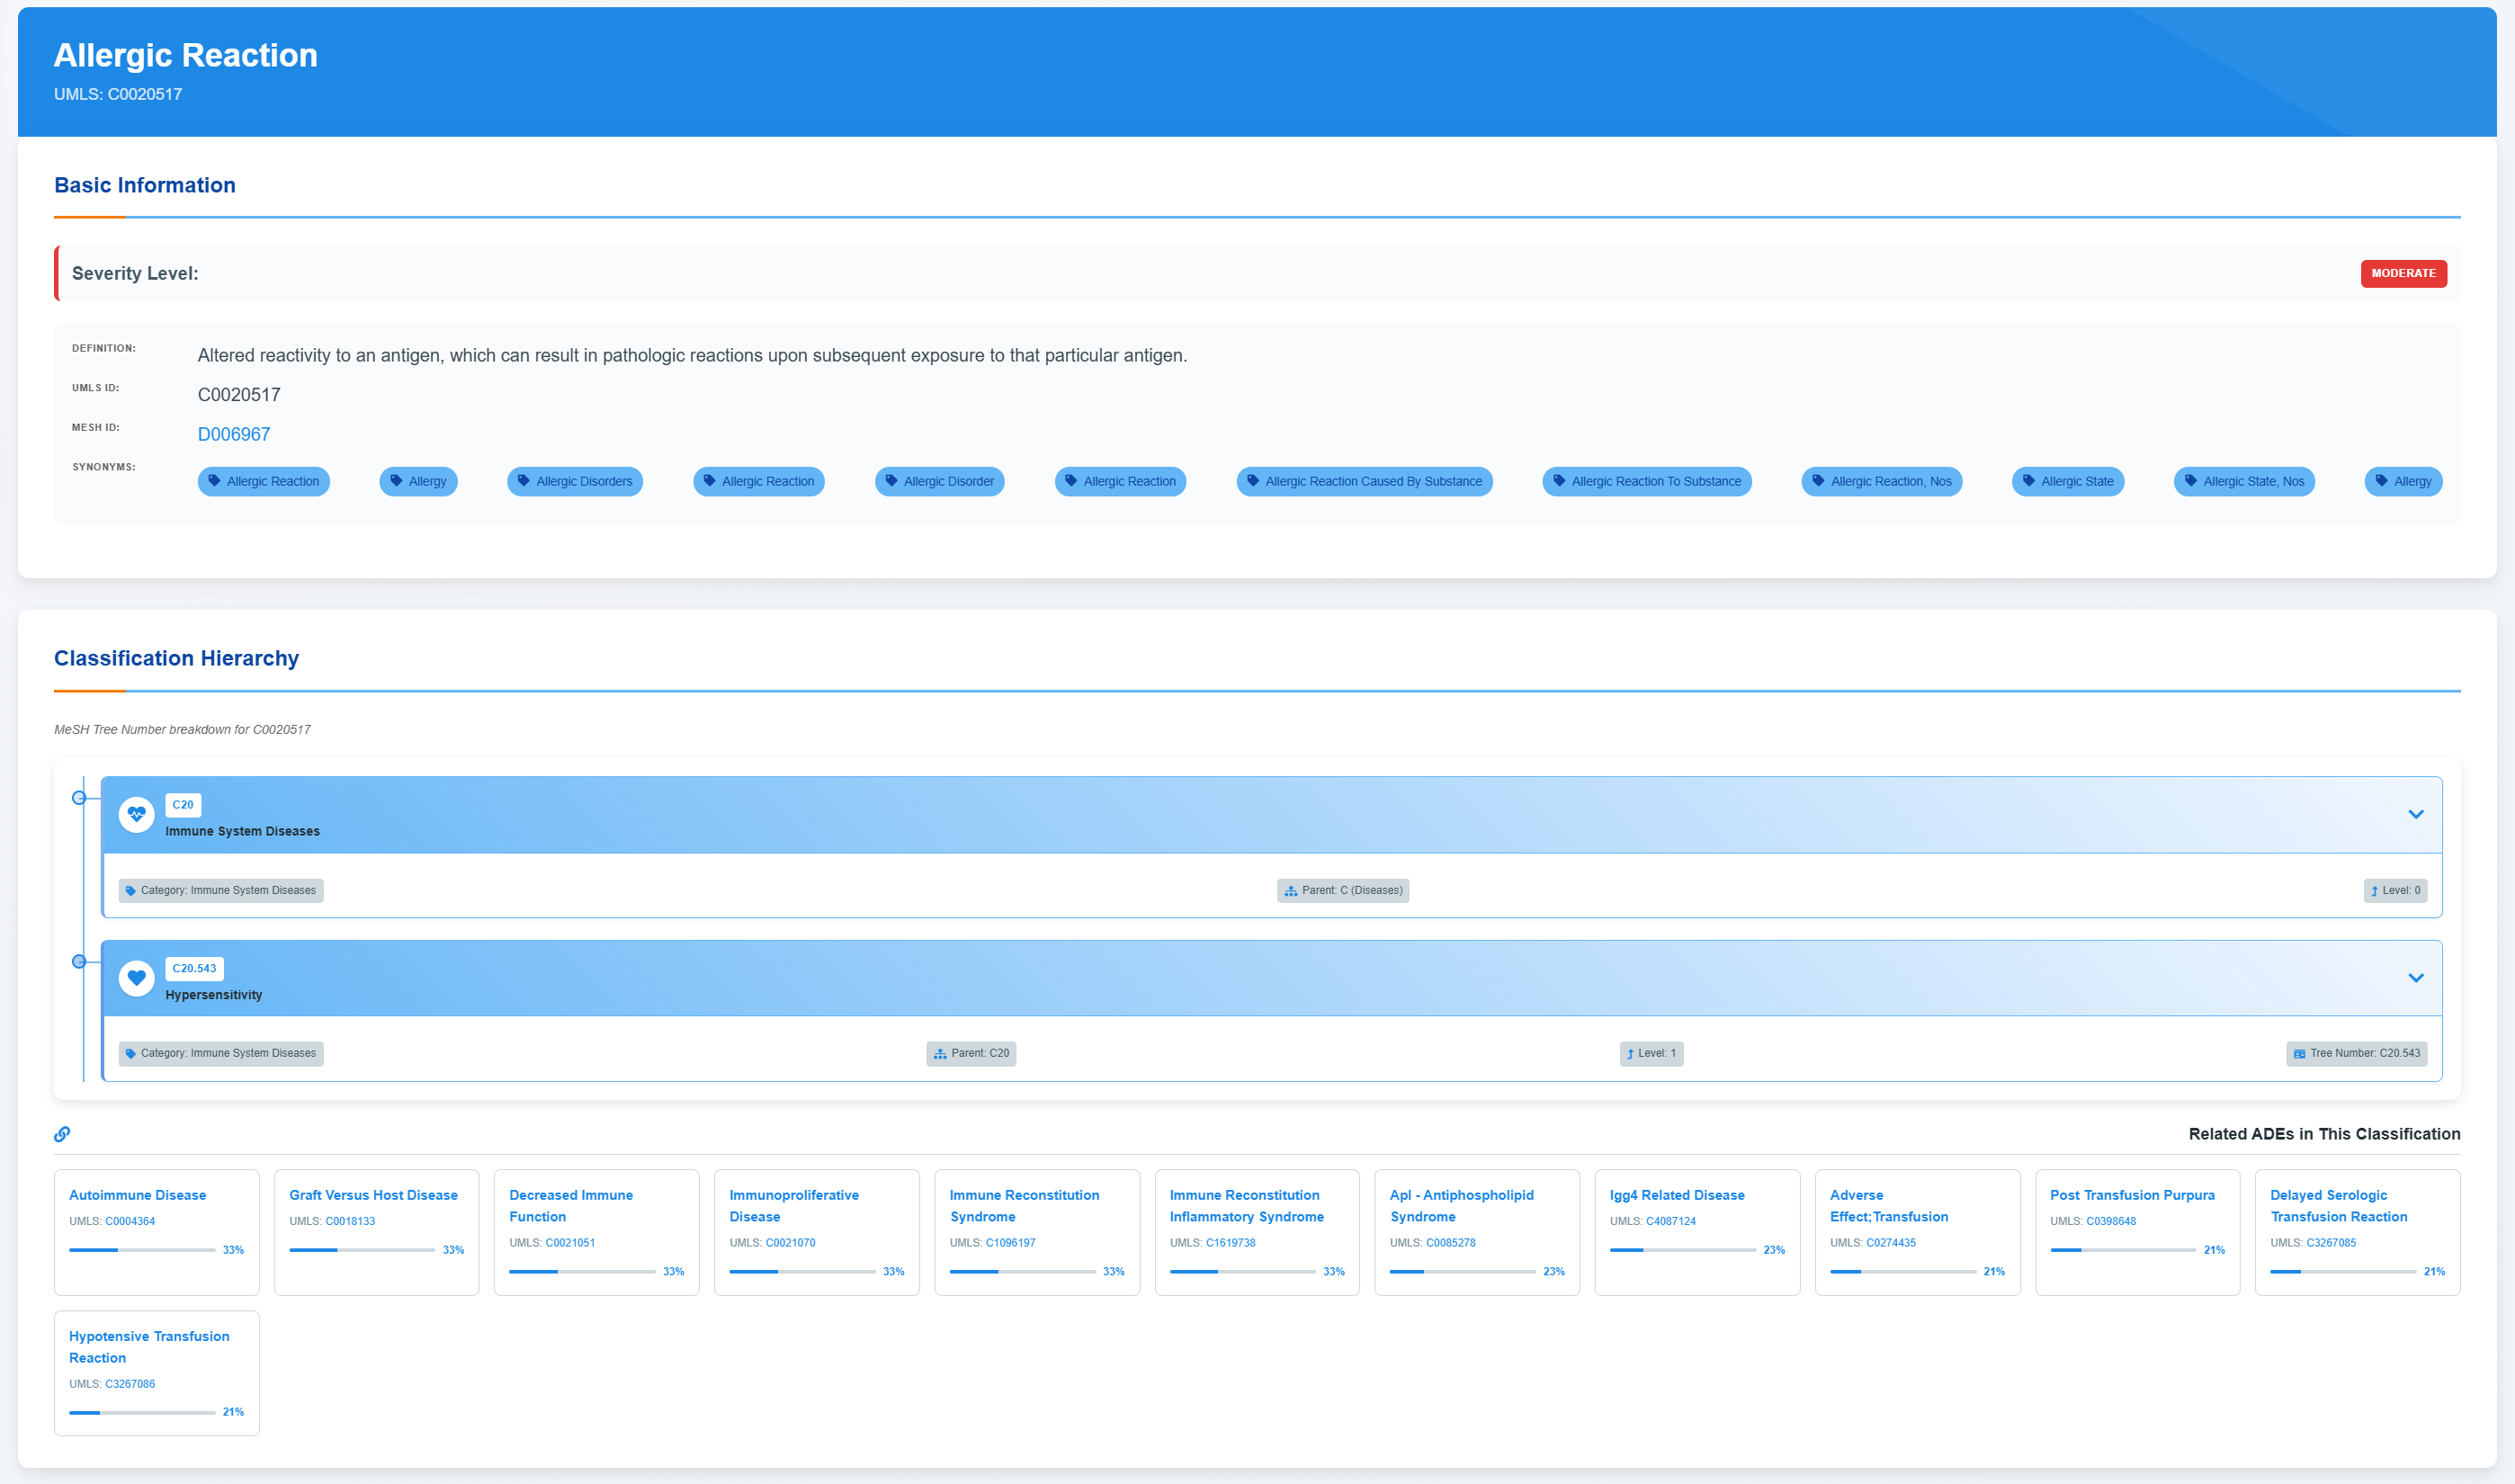
Access ADE Basic Information
Comprehensive adverse event profiles include standardized medical identifiers, severity classifications, and detailed clinical definitions describing pathophysiological mechanisms and response patterns.
Explore Classification Hierarchy
Browse the hierarchical medical classification tree and expand each level to view disease categories and associated terminology systems.
Review Related ADEs Classification
Review associated adverse events alongside their confidence metrics and standardized medical classifications.
Access Drug-Target-ADE Network
Use the “Expand to show all information” control to display the full set of drug–target–ADE associations, including total association counts and high-confidence links, and then explore the interactive network view and confidence distribution summaries.
🔗 Drug-Target-ADE Association Network
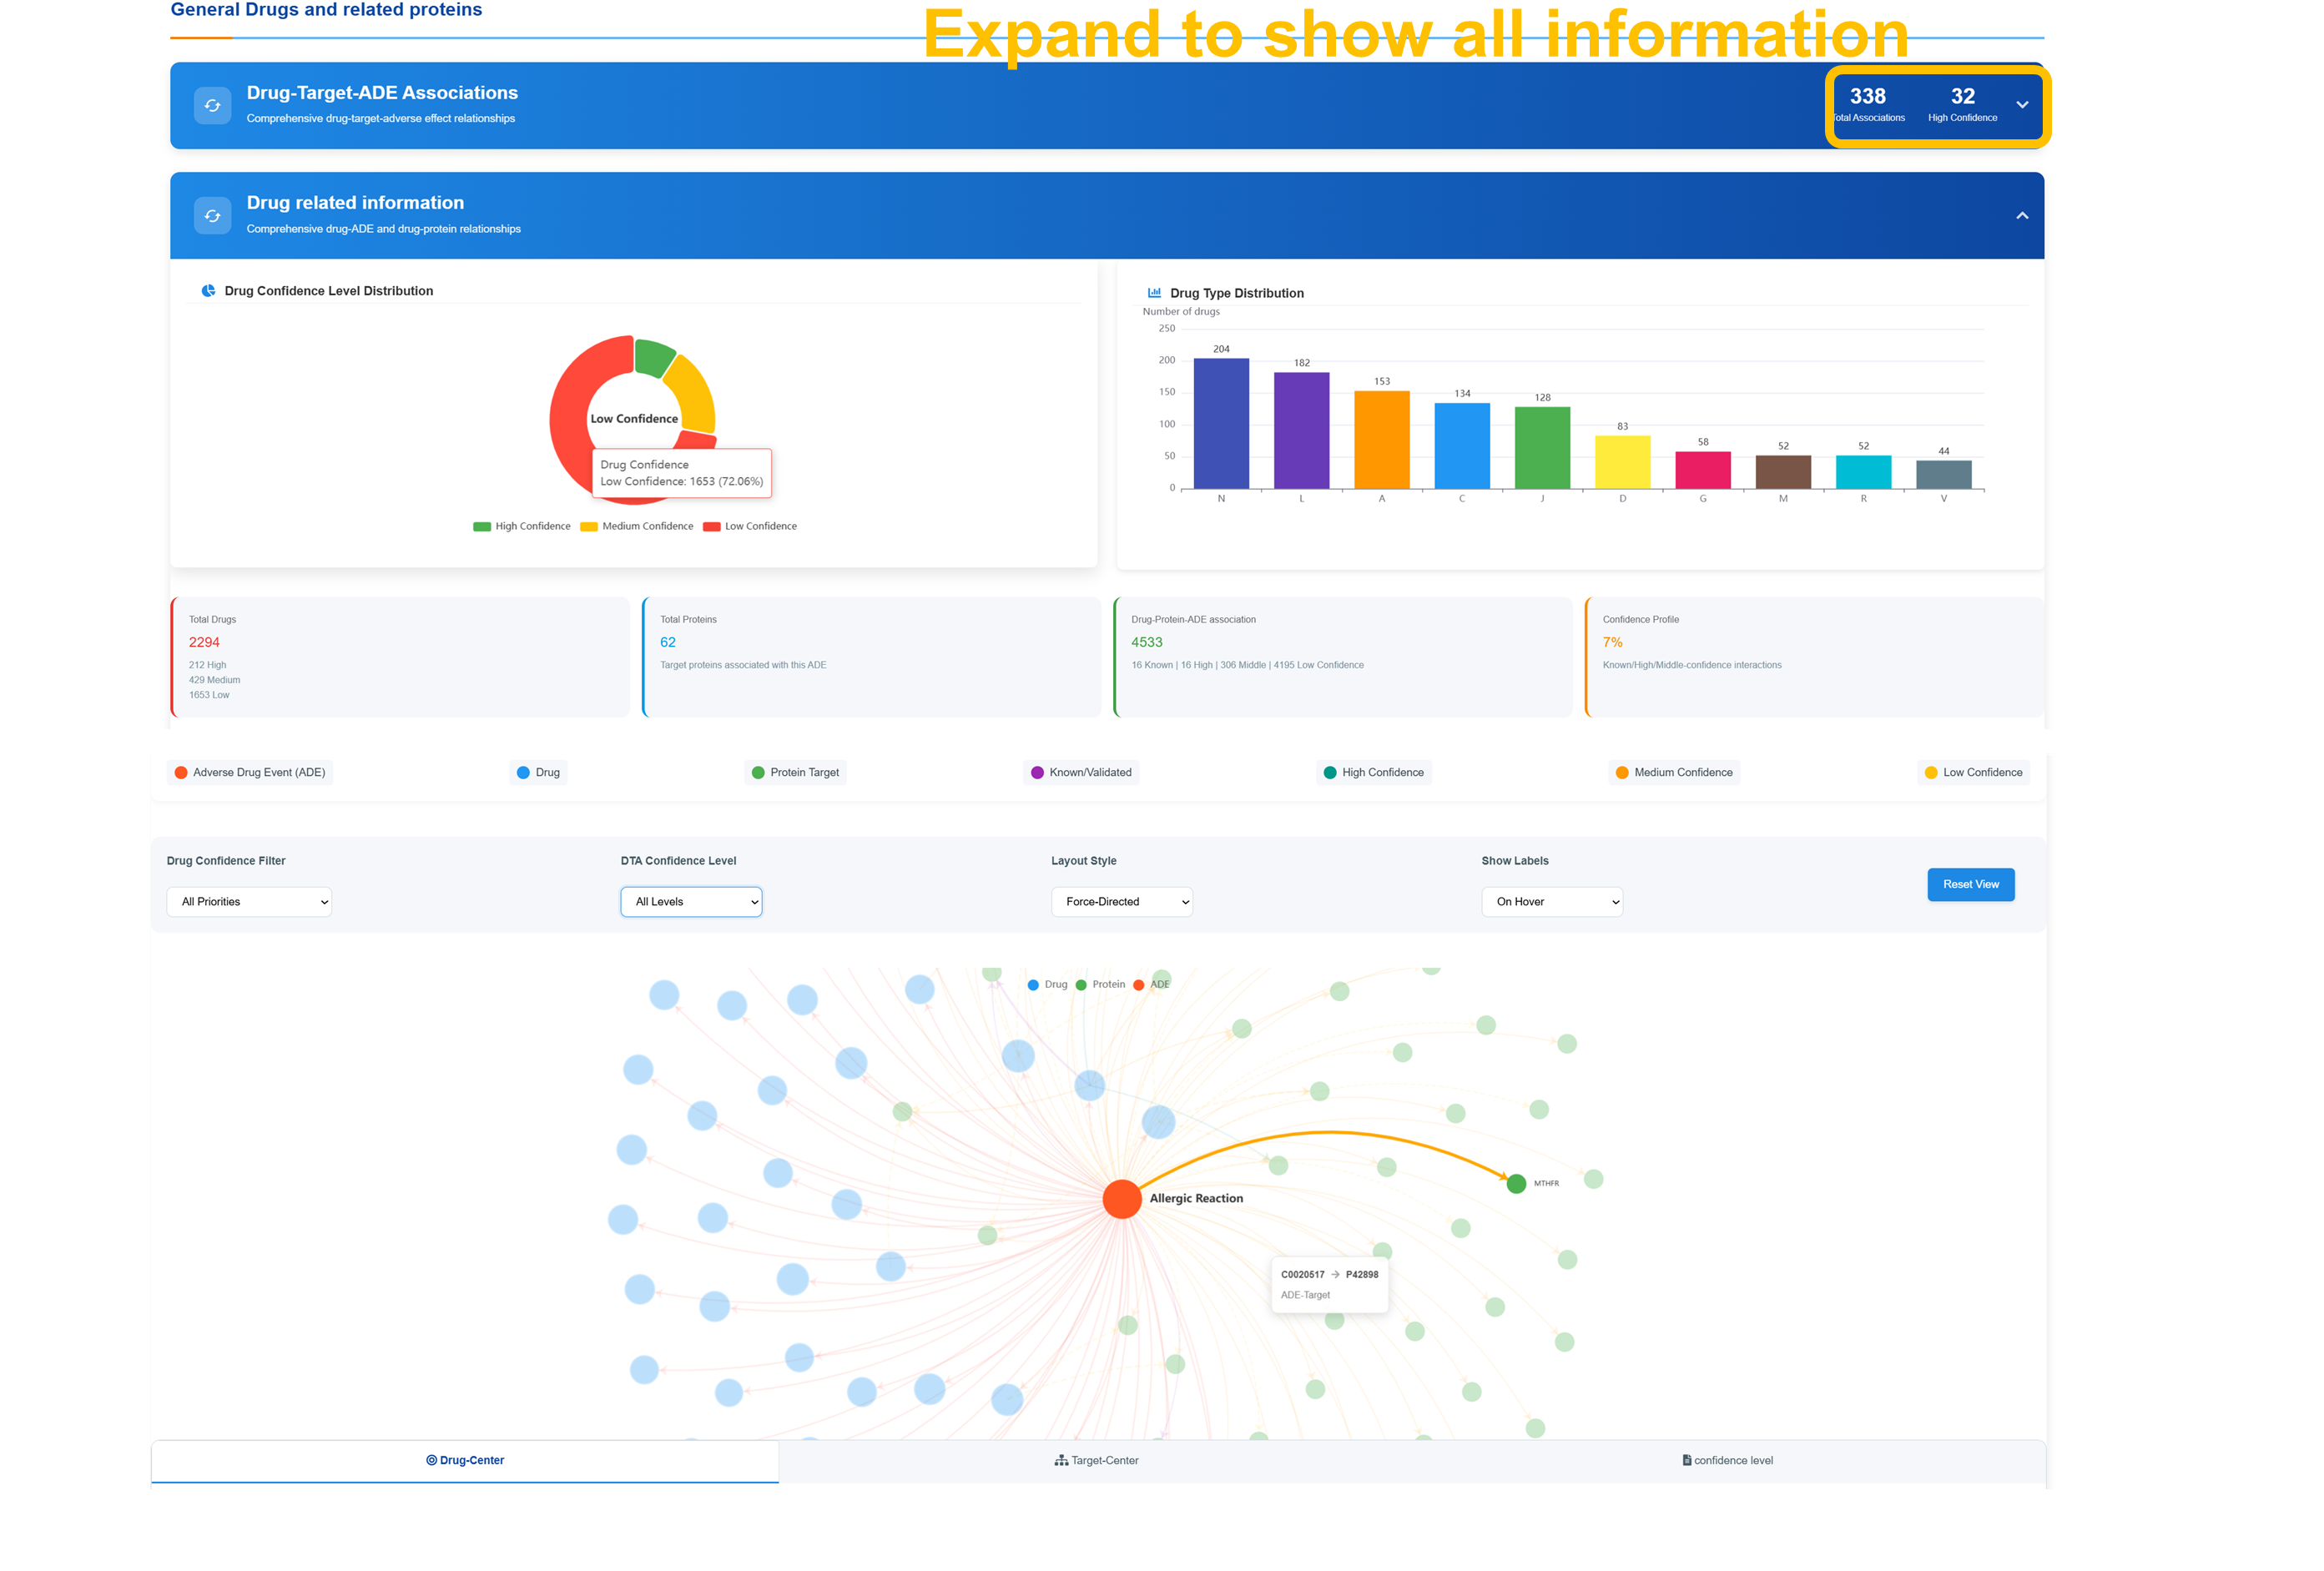
Analyze Confidence Level Distribution
Review the distribution of drug confidence levels across all entries, segmented into high, medium, and low tiers, and examine the statistical breakdown of drug types across pharmaceutical categories.
Navigate Interactive Network
Use Drug Confidence Filter to select confidence levels (All Priorities, High Confidence Only, Medium Confidence Only, Low Confidence Only). Apply DTA Confidence Level and Layout Style filters with Force-Directed visualization and Show Labels options for comprehensive network analysis.
Explore Network Components
Examine network visualization centered on "Allergic Reaction" node with connections to various drug and target nodes. Access detailed information through node interactions showing drug names, protein targets, and association confidence levels with color-coded classifications.
Access Statistical Analysis
Review comprehensive statistics including total ADE count, total protein count, total drug–protein–ADE associations, and confidence profile breakdowns. Use the “Reset View” control to optimize network visualization and perform detailed association analysis.
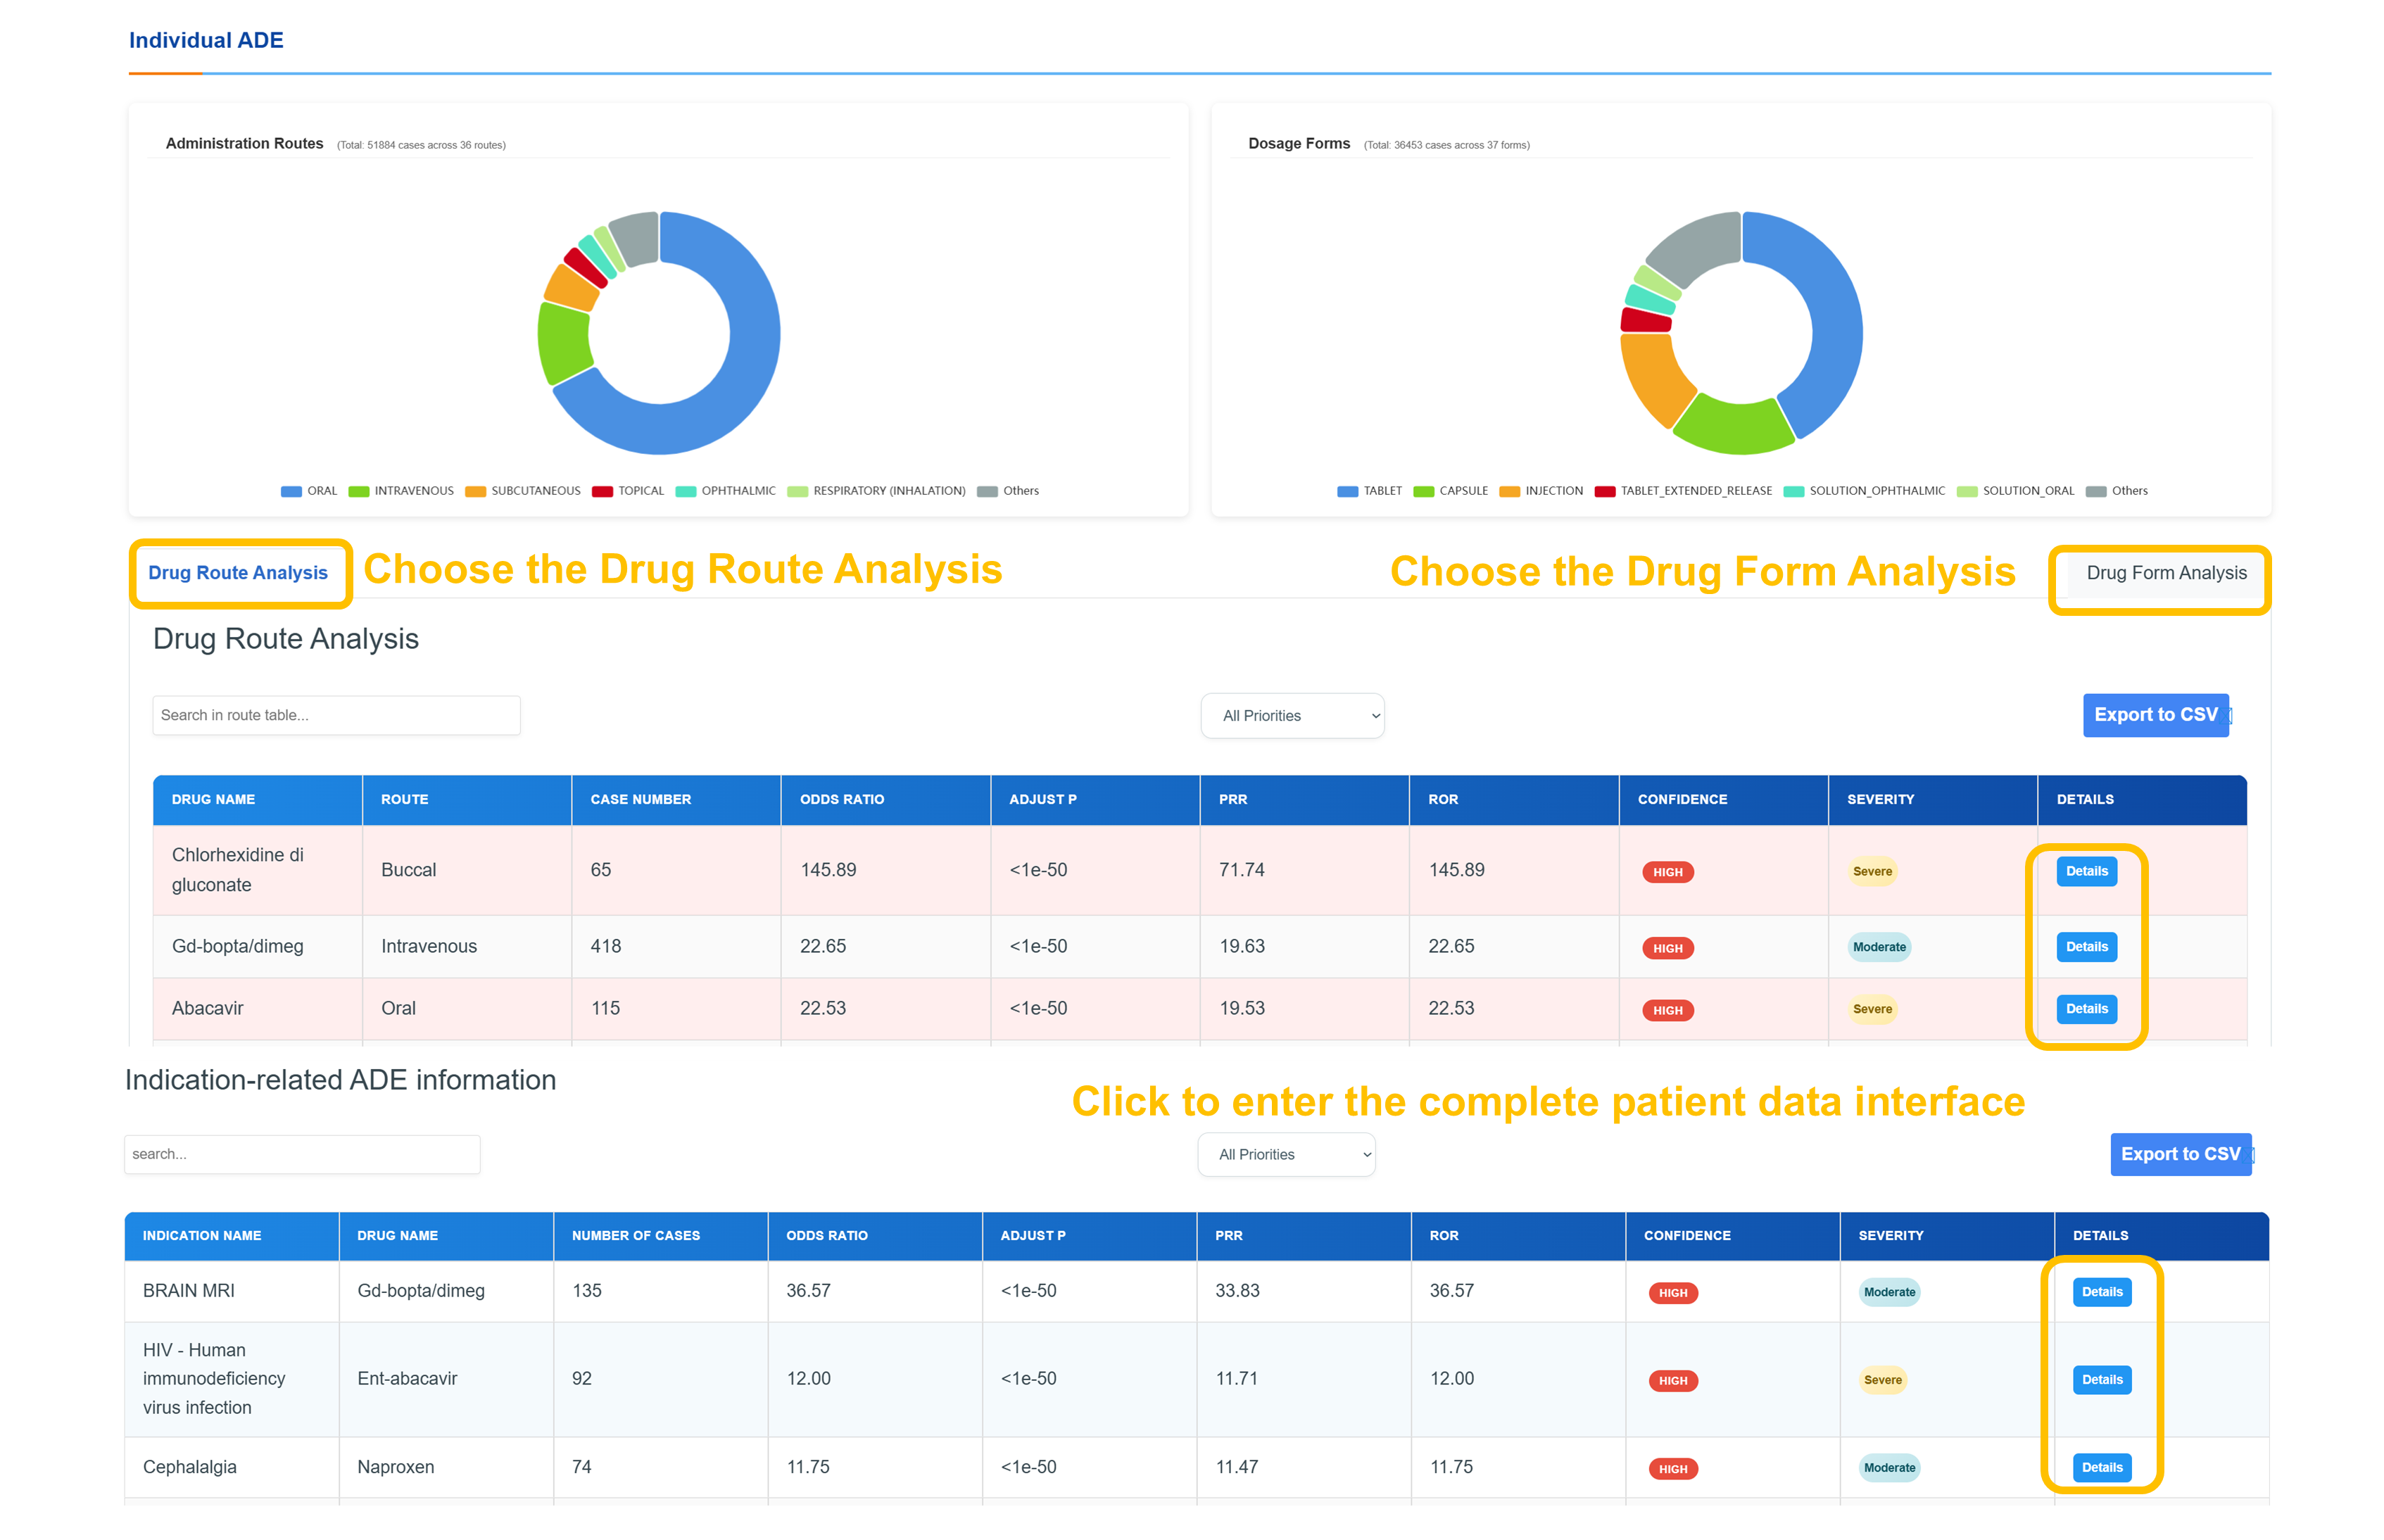
📊 Individual ADE Analysis - Route & Form Distribution
Analyze Administration Routes
Review Administration Routes distribution from 51588 cases across 30 routes showing ORAL (predominant), INTRAVENOUS, SUBCUTANEOUS, TOPICAL, OPHTHALMIC, and RESPIRATORY (INHALATION) routes. Examine Dosage Forms from 30821 cases across 37 forms including TABLET, CAPSULE, INJECTION, and various specialized formulations.
Navigate Drug Route Analysis
Use "Drug Route Analysis" and "Drug Form Analysis" buttons to access detailed breakdowns. Search route tables by drug name and examine comprehensive data including Case Number, Odds Ratio, Adjust P values, PRR, ROR, Confidence levels, and Severity assessments for evidence-based analysis.
Review Specific Drug Analysis
Review detailed drug entries including administration route, case count, statistical measures (e.g., odds ratios), confidence level classifications, and severity assessments with full statistical profiles.
Access Indication-Related Information
Click “Enter the complete patient data interface” to retrieve indication-related ADE data with case counts, confidence and severity assessments, and CSV export functionality.
Medical Classification System
- Integration of standardized medical terminologies for ADEs
- Hierarchical medical coding with tree number organization
- System organ class categorization and pathological classification
- Severity level assessment (Moderate classification)
- Clinical manifestation descriptions and medical definitions
- Related ADE classification network with confidence scoring
Association Network Analysis
- 338 drug-target-ADE associations with 32 high confidence connections
- Interactive network visualization with confidence filtering
- Statistical distribution analysis (High: 72.95%, Medium, Low)
- Force-directed layout with customizable visualization options
- Color-coded confidence levels and association strength indicators
- Comprehensive drug type distribution across pharmaceutical categories
Route & Form Distribution
- Case reports analyzed across multiple administration routes
- Cases analyzed across various dosage forms with detailed breakdowns
- Statistical analysis with Odds Ratios, PRR, ROR calculations
- Confidence level assessment (HIGH, MEDIUM) with severity grading
- Indication-related ADE information with patient data interface
- CSV export capabilities for comprehensive data analysis
🎯 Target Information
Protein targets, 3D structural analysis, and mechanism-based safety assessment
🧬 Target Profile
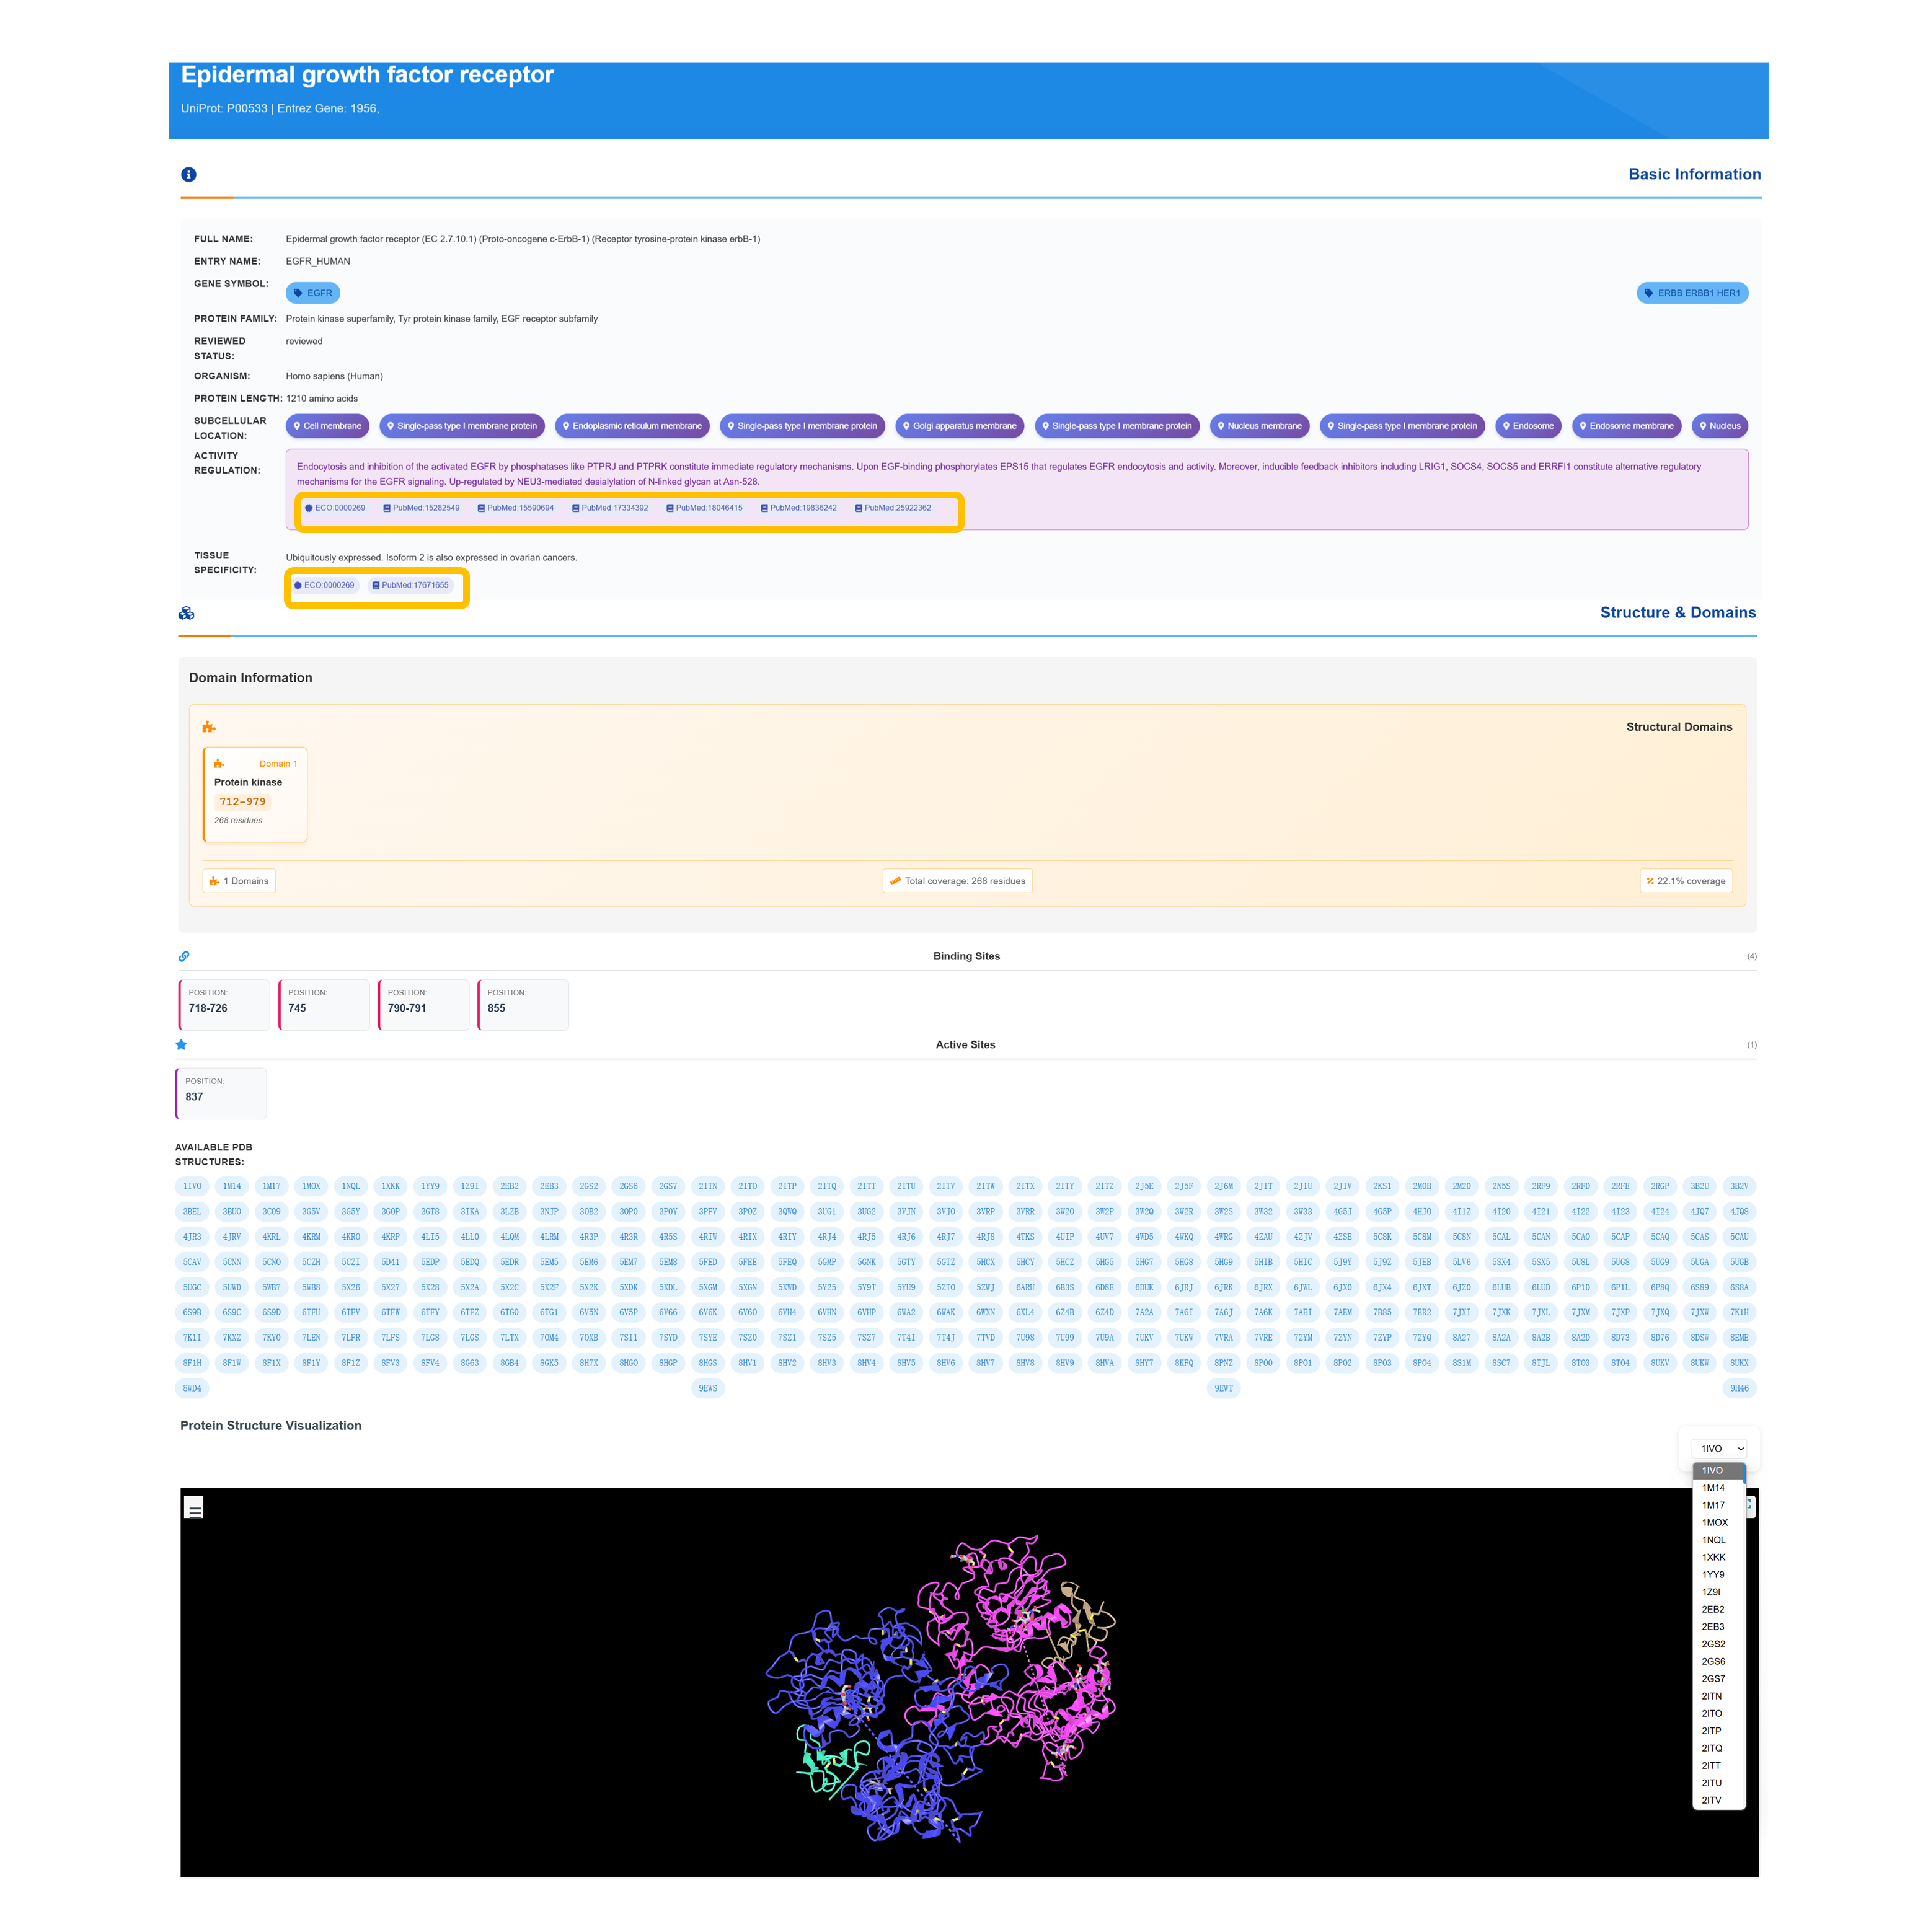
Access Target Basic Information
Retrieve detailed protein profile, including standardized accession numbers, entry name, gene symbol, review status, species classification, protein family membership, and amino acid sequence length.
Explore Subcellular Localization
Browse subcellular localization categories—including cell membrane, single-pass type I membrane, endoplasmic reticulum membrane, Golgi apparatus membrane, nuclear membrane, endosome, and secreted—along with detailed functional annotations and regulatory mechanism insights.
Review Structure & Domains
Review domain architecture details—including domain types with residue ranges, structural domain analyses, binding site visualizations, and active site identifications—and access associated PDB entries along with overall domain coverage metrics.
Access 3D Structure Visualization
Use the “Structure & Domains” panel to launch an interactive 3D protein viewer that highlights annotated binding‐site residues and provides access to all available PDB entries for in‐depth structural exploration.
🔗 Drug-Target-ADE Association Network
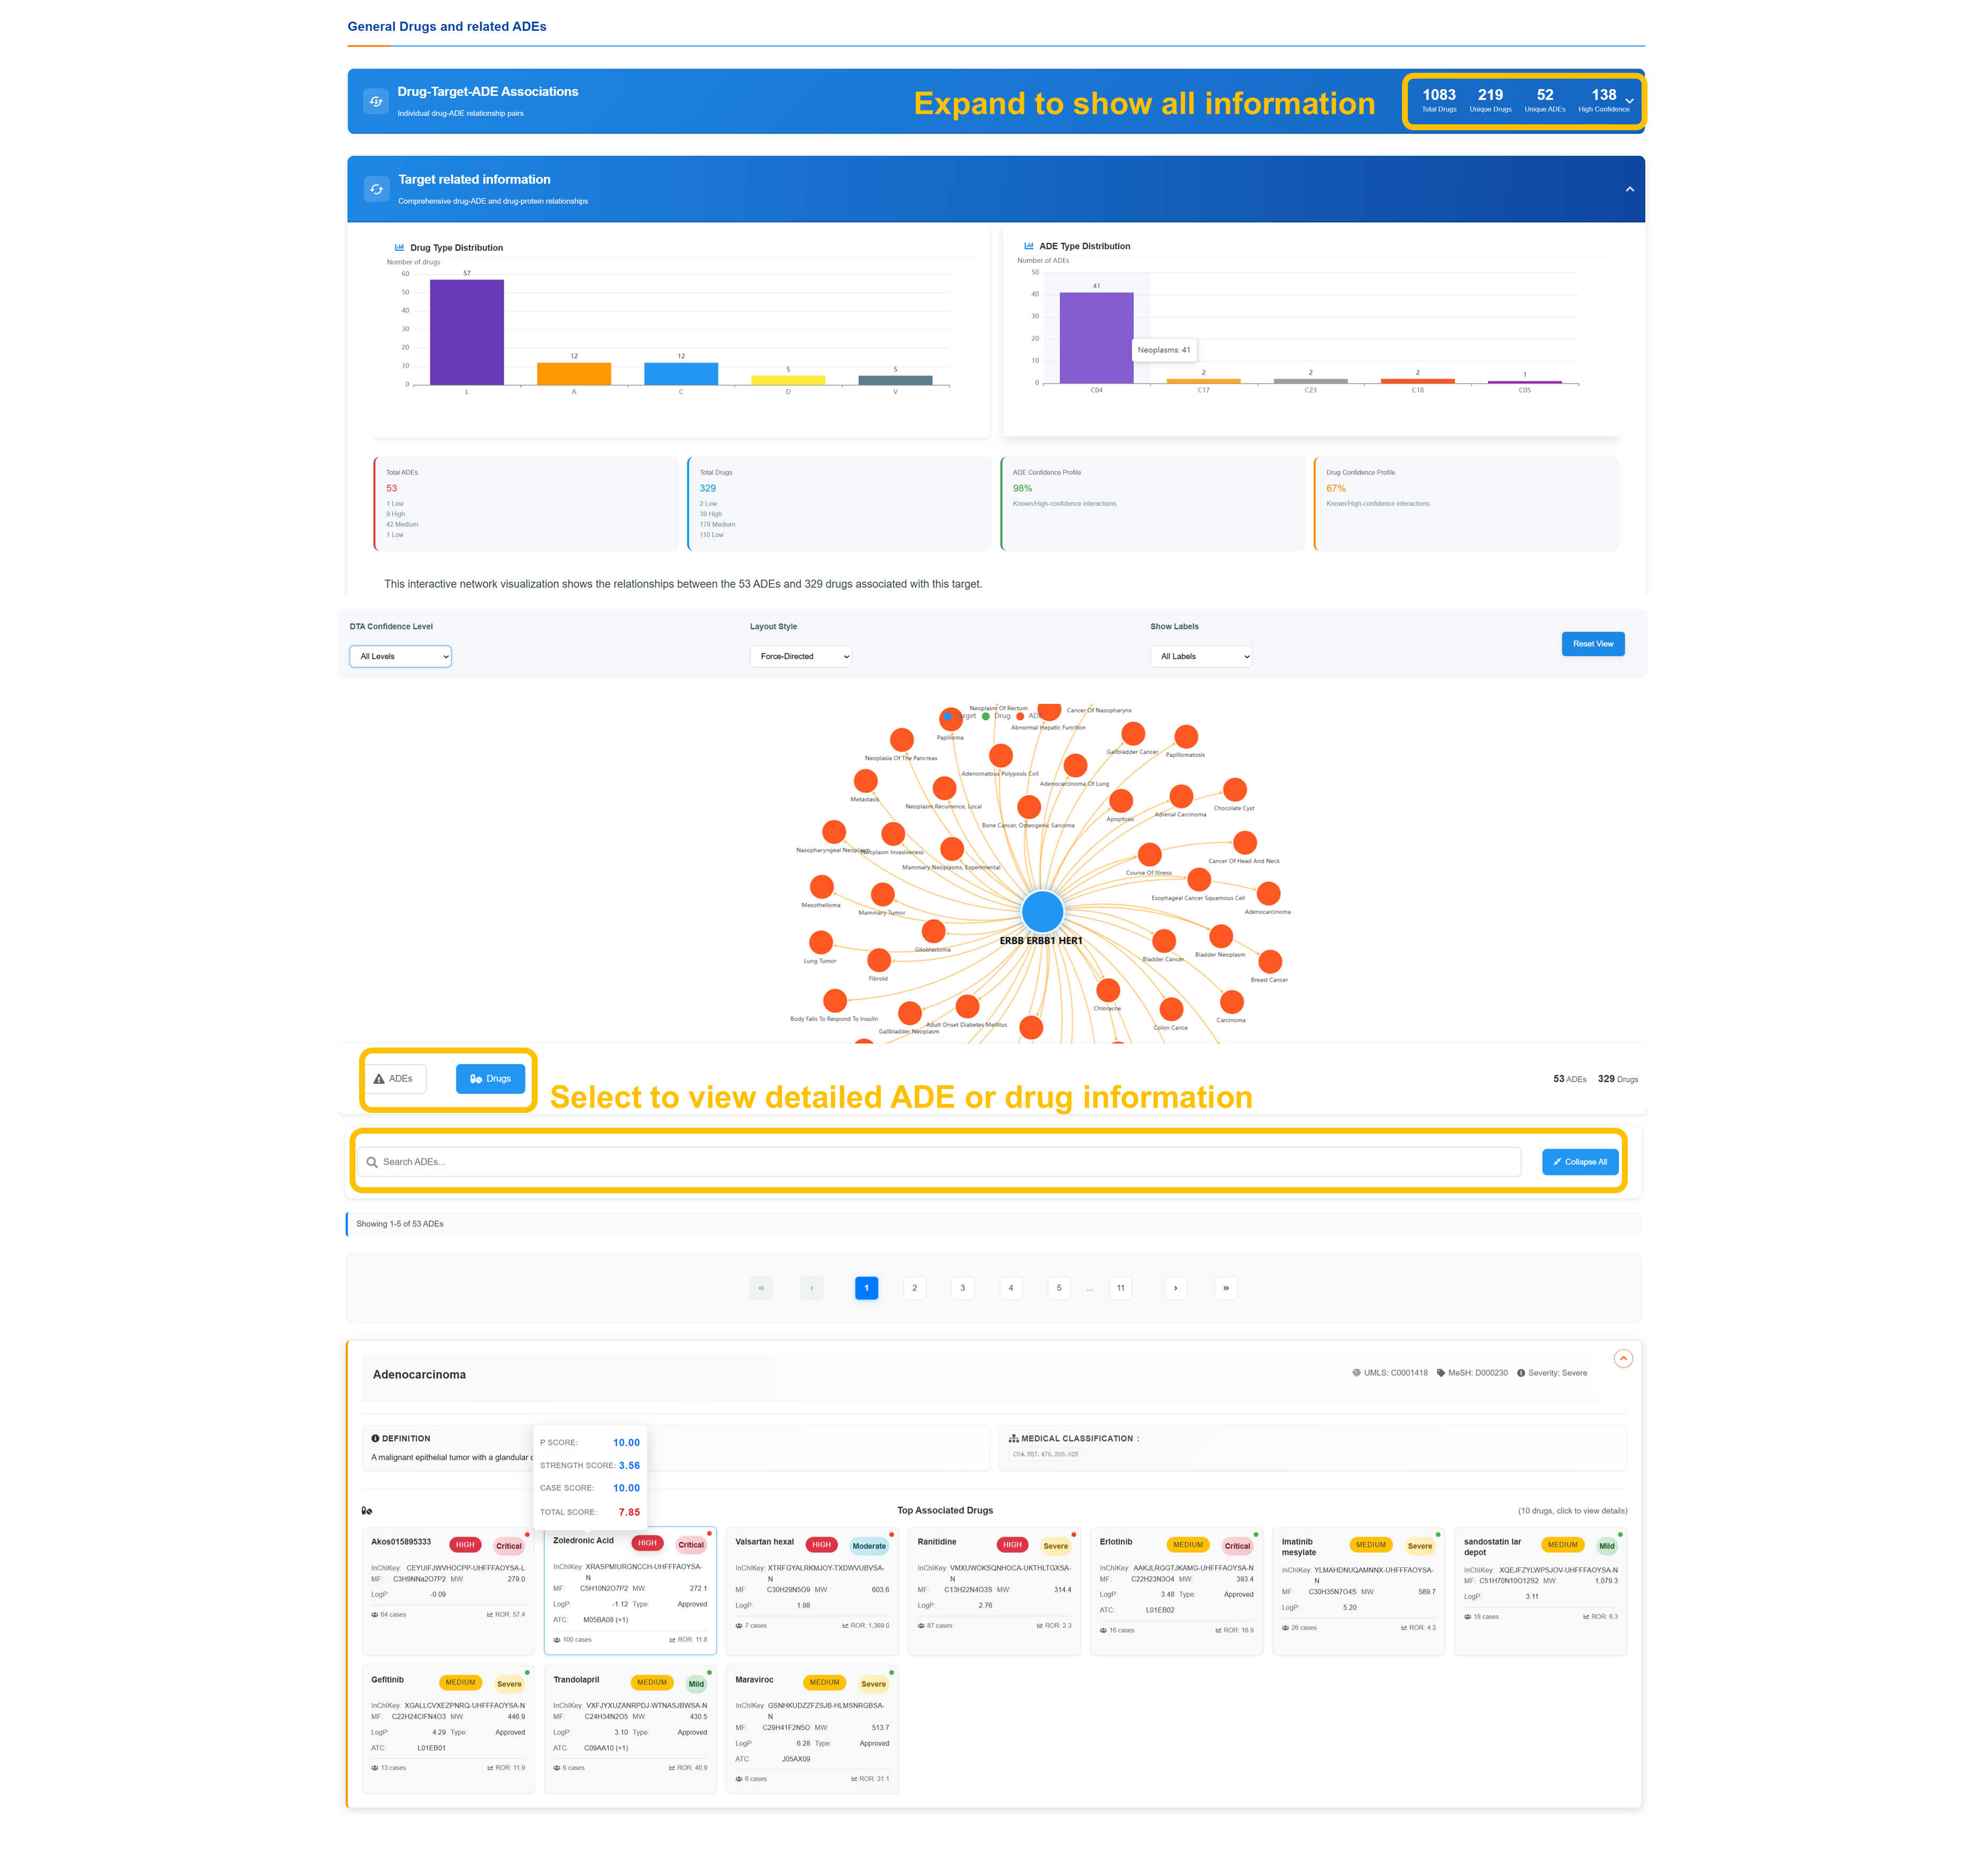
Analyze Target Distribution
Review Drug Type Distribution and ADE Type Distribution showing comprehensive statistical breakdown. Examine target-related information with detailed drug and ADE classifications including distribution patterns and association frequencies across pharmaceutical categories.
Navigate Interactive Target Network
Apply the DTA confidence‐level filters, select a force-directed layout, and enable labels to tailor the network view. Center the graph on your chosen node to explore its linked drugs and ADEs, with connection patterns and confidence metrics clearly displayed.
Select Detailed Information
Use the “Select to view detailed information” control to open the in-depth analysis panel. Apply the built-in search filters to narrow ADEs or drugs, use the “Collapse All” feature for a streamlined view, and move through the complete result set via pagination controls.
Review Associated ADEs Analysis
Review individual adverse event entries with standardized medical identifiers, severity classification, top associated compounds, and detailed confidence profiles accompanied by statistical analyses.
Protein Target Profiles
- Comprehensive UniProt integration for standardized protein identifiers
- Gene symbol mapping and protein family classification
- Functional annotation including sequence length details
- Subcellular localization across multiple cellular compartments
- Regulatory mechanisms and post-translational modifications
- Tissue specificity profiling and organism classification
3D Structure Analysis
- Interactive 3D molecular visualization with annotated binding site mapping
- Protein domain identification and sequence mapping
- Structural domain analysis with coverage metrics
- Integration of available 3D structural datasets
- Visualization of binding region annotations
- Active site annotation and molecular representation tools
Network Association Analysis
- Comprehensive mapping of drug–target–ADE network associations
- Integration of adverse events and targets within a unified network
- Interactive force-directed visualization for relationship exploration
- Filtering capabilities across multiple confidence tiers
- Statistical distribution analysis of network components
- Combined drug classification and ADE severity assessment
📊 Analytics Dashboard
Advanced statistical analysis and interactive data visualization
📊 Report Analytics Dashboard - Comprehensive Analysis
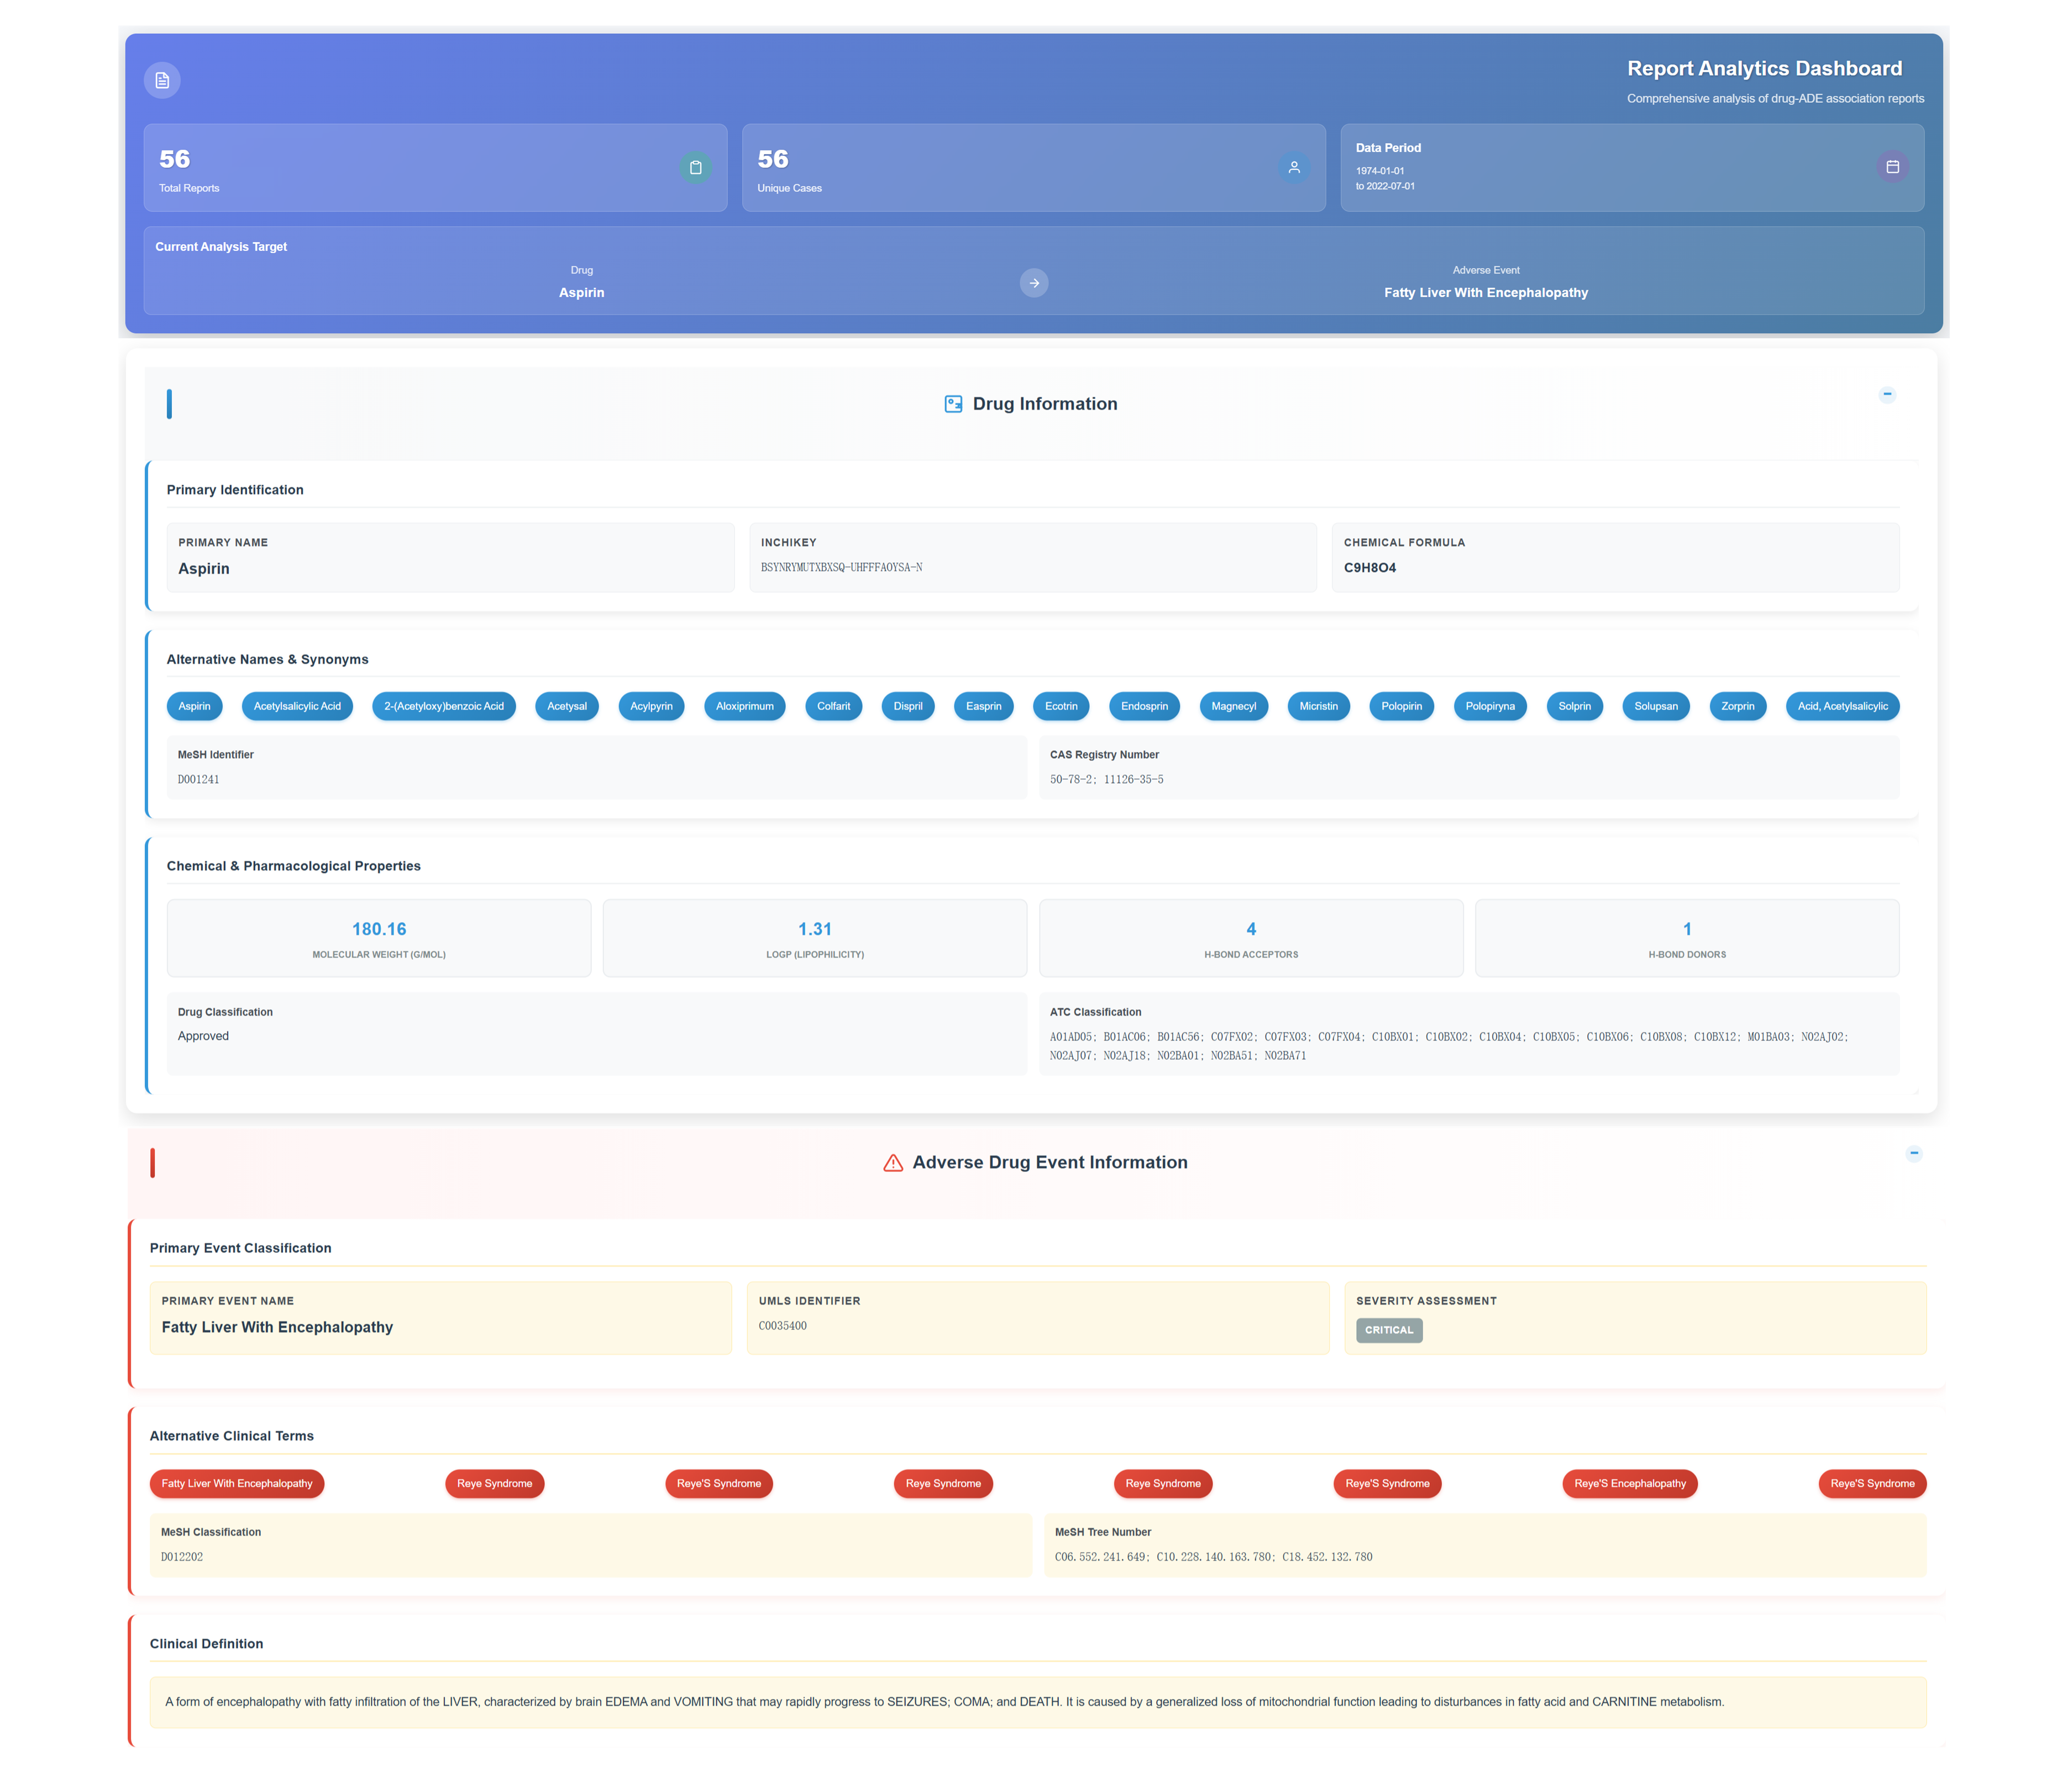
Access Report Analytics Dashboard
Access the comprehensive analysis interface displaying total report and unique case counts for the selected drug–ADE pair. Review the active analysis target and defined data period with expandable sections for detailed insights.
Review Drug Information Section
Review primary compound identification details—including standardized chemical identifiers (InChIKey, chemical formula), an extensive alias and synonym tagging system, and key chemical–pharmacological attributes such as molecular weight, Log P, hydrogen bond acceptor count, and donor count.
Analyze Adverse Drug Event Information
Primary event classification includes standardized identifiers, severity assessment levels, alternative clinical terminology, and detailed clinical definitions encompassing organ characteristics and metabolic pathway impacts.
Access Expandable Data Sections
Click through expandable sections including Drug-ADE Association Reports with Patient Information, Medication Database with route & dosage analysis, and Report Records with dechallenge/rechallenge response data for comprehensive patient data analysis and temporal reporting patterns.
👥 Drug-ADE Association Reports - Patient Demographics
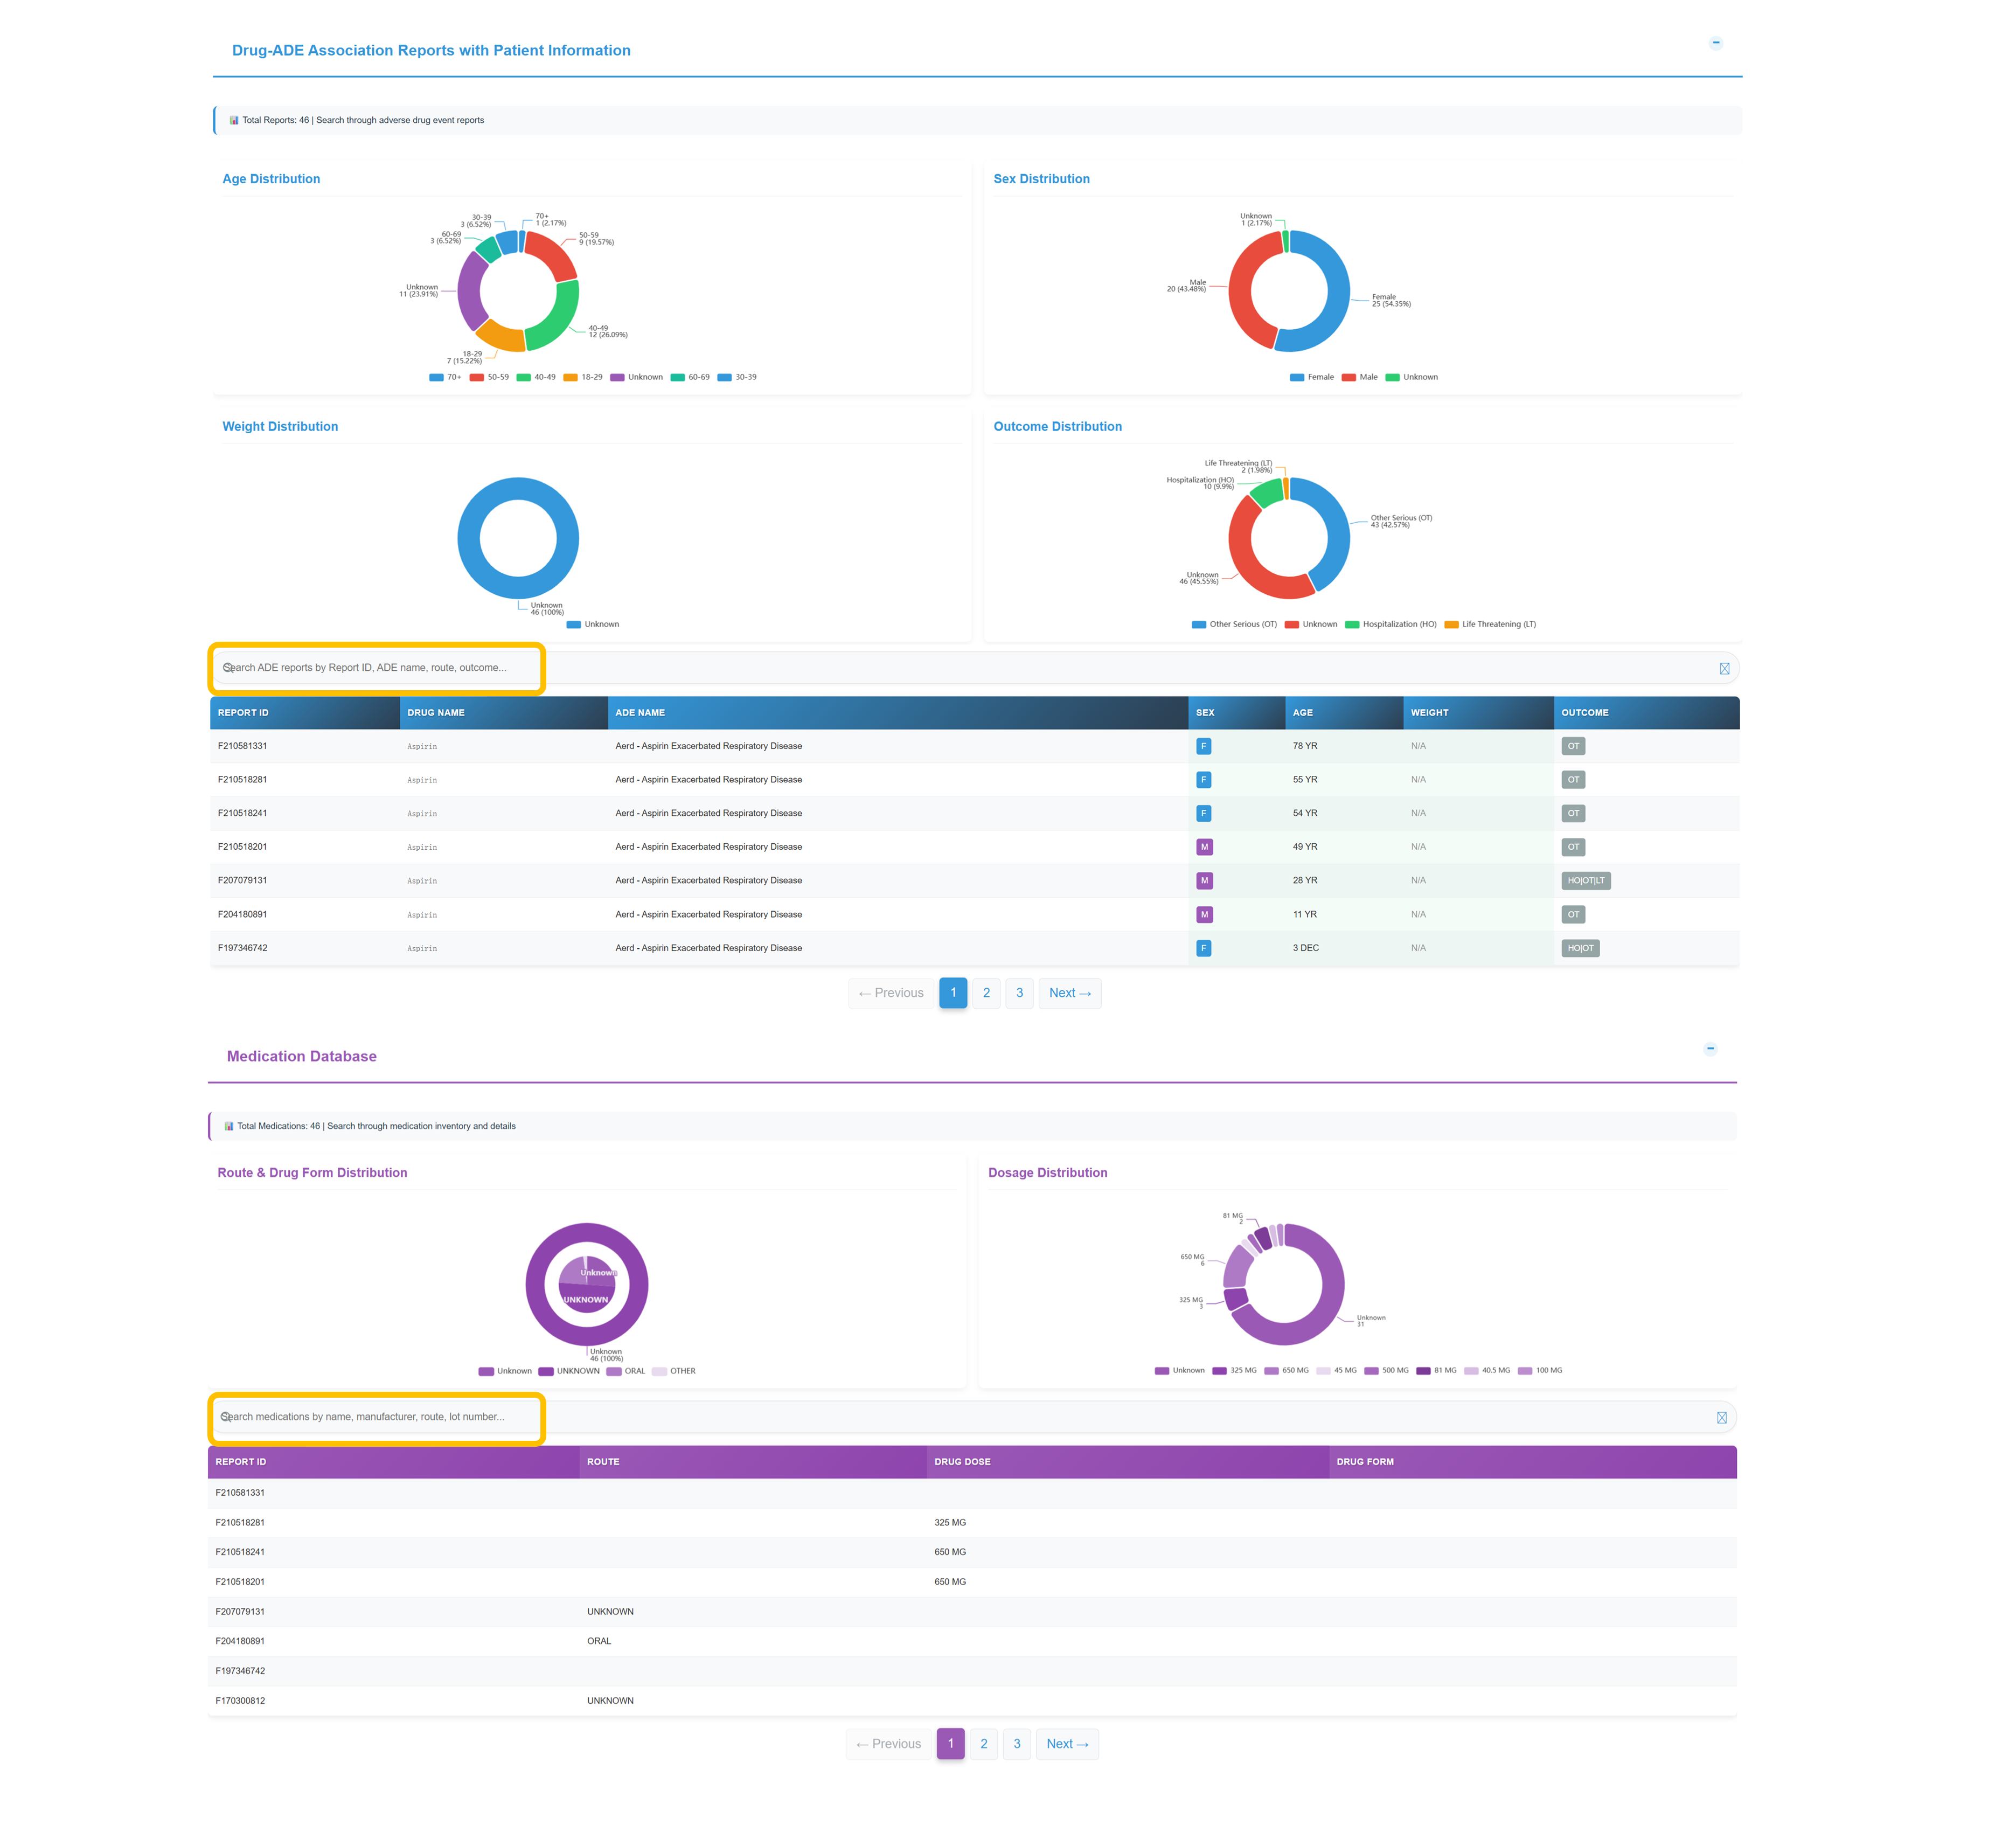
Analyze Patient Demographics
Review comprehensive demographic analysis from 46 total records showing Age Distribution (60-69: 7 cases, 50-59: 6 cases, 40-49: 5 cases), Sex Distribution (Female: 22 cases, Male: 19 cases), Weight Distribution (predominantly unknown), and Outcome Distribution (Other Serious: 17 cases, Unknown: 20 cases, Hospitalization: 6 cases).
Search and Filter Patient Records
Filter ADE reports by report identifier, event term, administration route, or outcome, and retrieve detailed patient-level fields: report ID, drug, ADE term, sex, age, and outcome classification.
Navigate Medication Database
Distribution of administration routes and dosage forms across records; dosage distribution patterns; and detailed medication-level data with report identifiers, administration route, dosage amount, and formulation classifications.
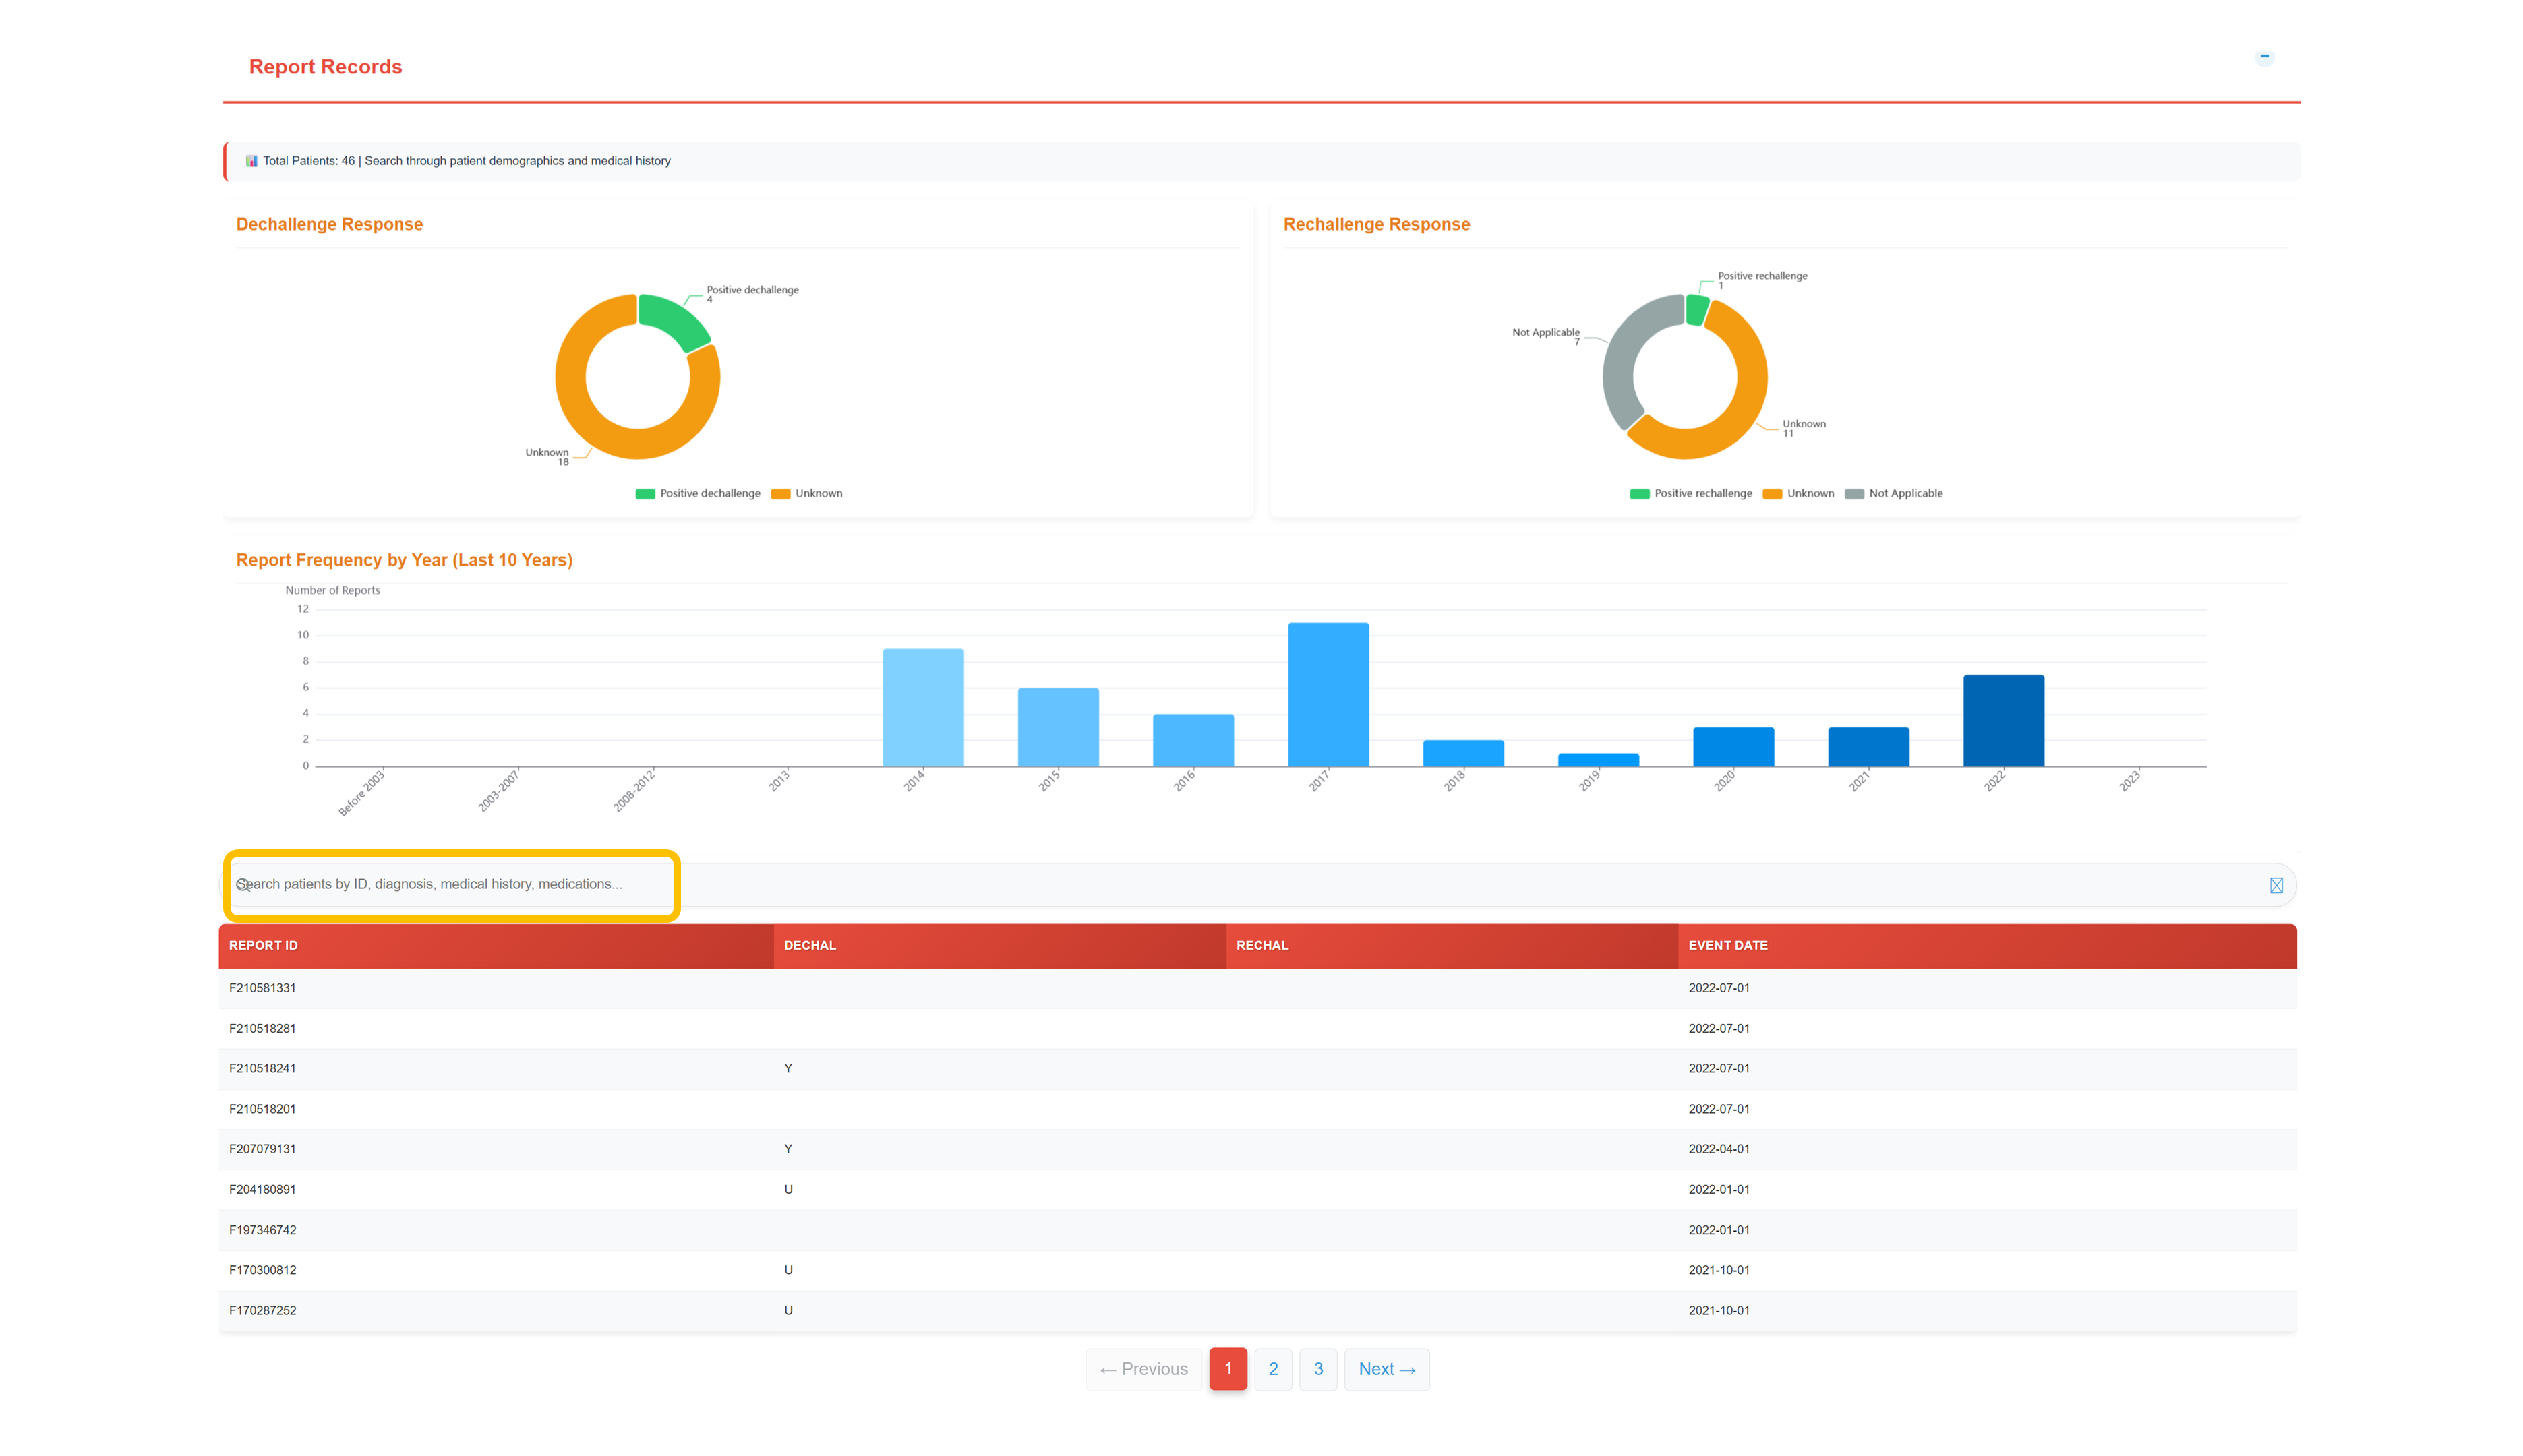
Review Report Records & Temporal Patterns
Temporal analysis of dechallenge and rechallenge responses with yearly report frequency trends; detailed records include dechallenge/rechallenge status indicators and event dates for causality and trend evaluation.
Chemical Properties Analysis
- Complete molecular structure visualization
- Detailed chemical identifiers and SMILES notation
- Molecular weight and TPSA analysis
- ATC classification codes and CAS numbers
- Structural similarity scoring with related compounds
- Hydrogen bond acceptor/donor analysis
Safety Profile Assessment
- Comprehensive ADE analysis across the full result set
- Quantitative confidence scoring system stratifying associations by evidence strength.
- Severity classification based on quantitative scoring
- Analysis of documented patient case counts
- Frequency analysis of drug-specific occurrence rates
- Validation through literature citations and reference identifiers
Target Interaction Network
- Mapping of comprehensive drug–target–ADE associations
- Identification of high-confidence target interactions
- Interactive network visualization for relationship exploration
- In-depth protein target analysis with associated adverse events
- Confidence level filtering (WILD, HIGH, MEDIUM, LOW)
- Pathway analysis supported by literature citations
📊 Analytics Dashboard
Advanced statistical analysis and interactive data visualization
📊 PersADE Statistics Overview
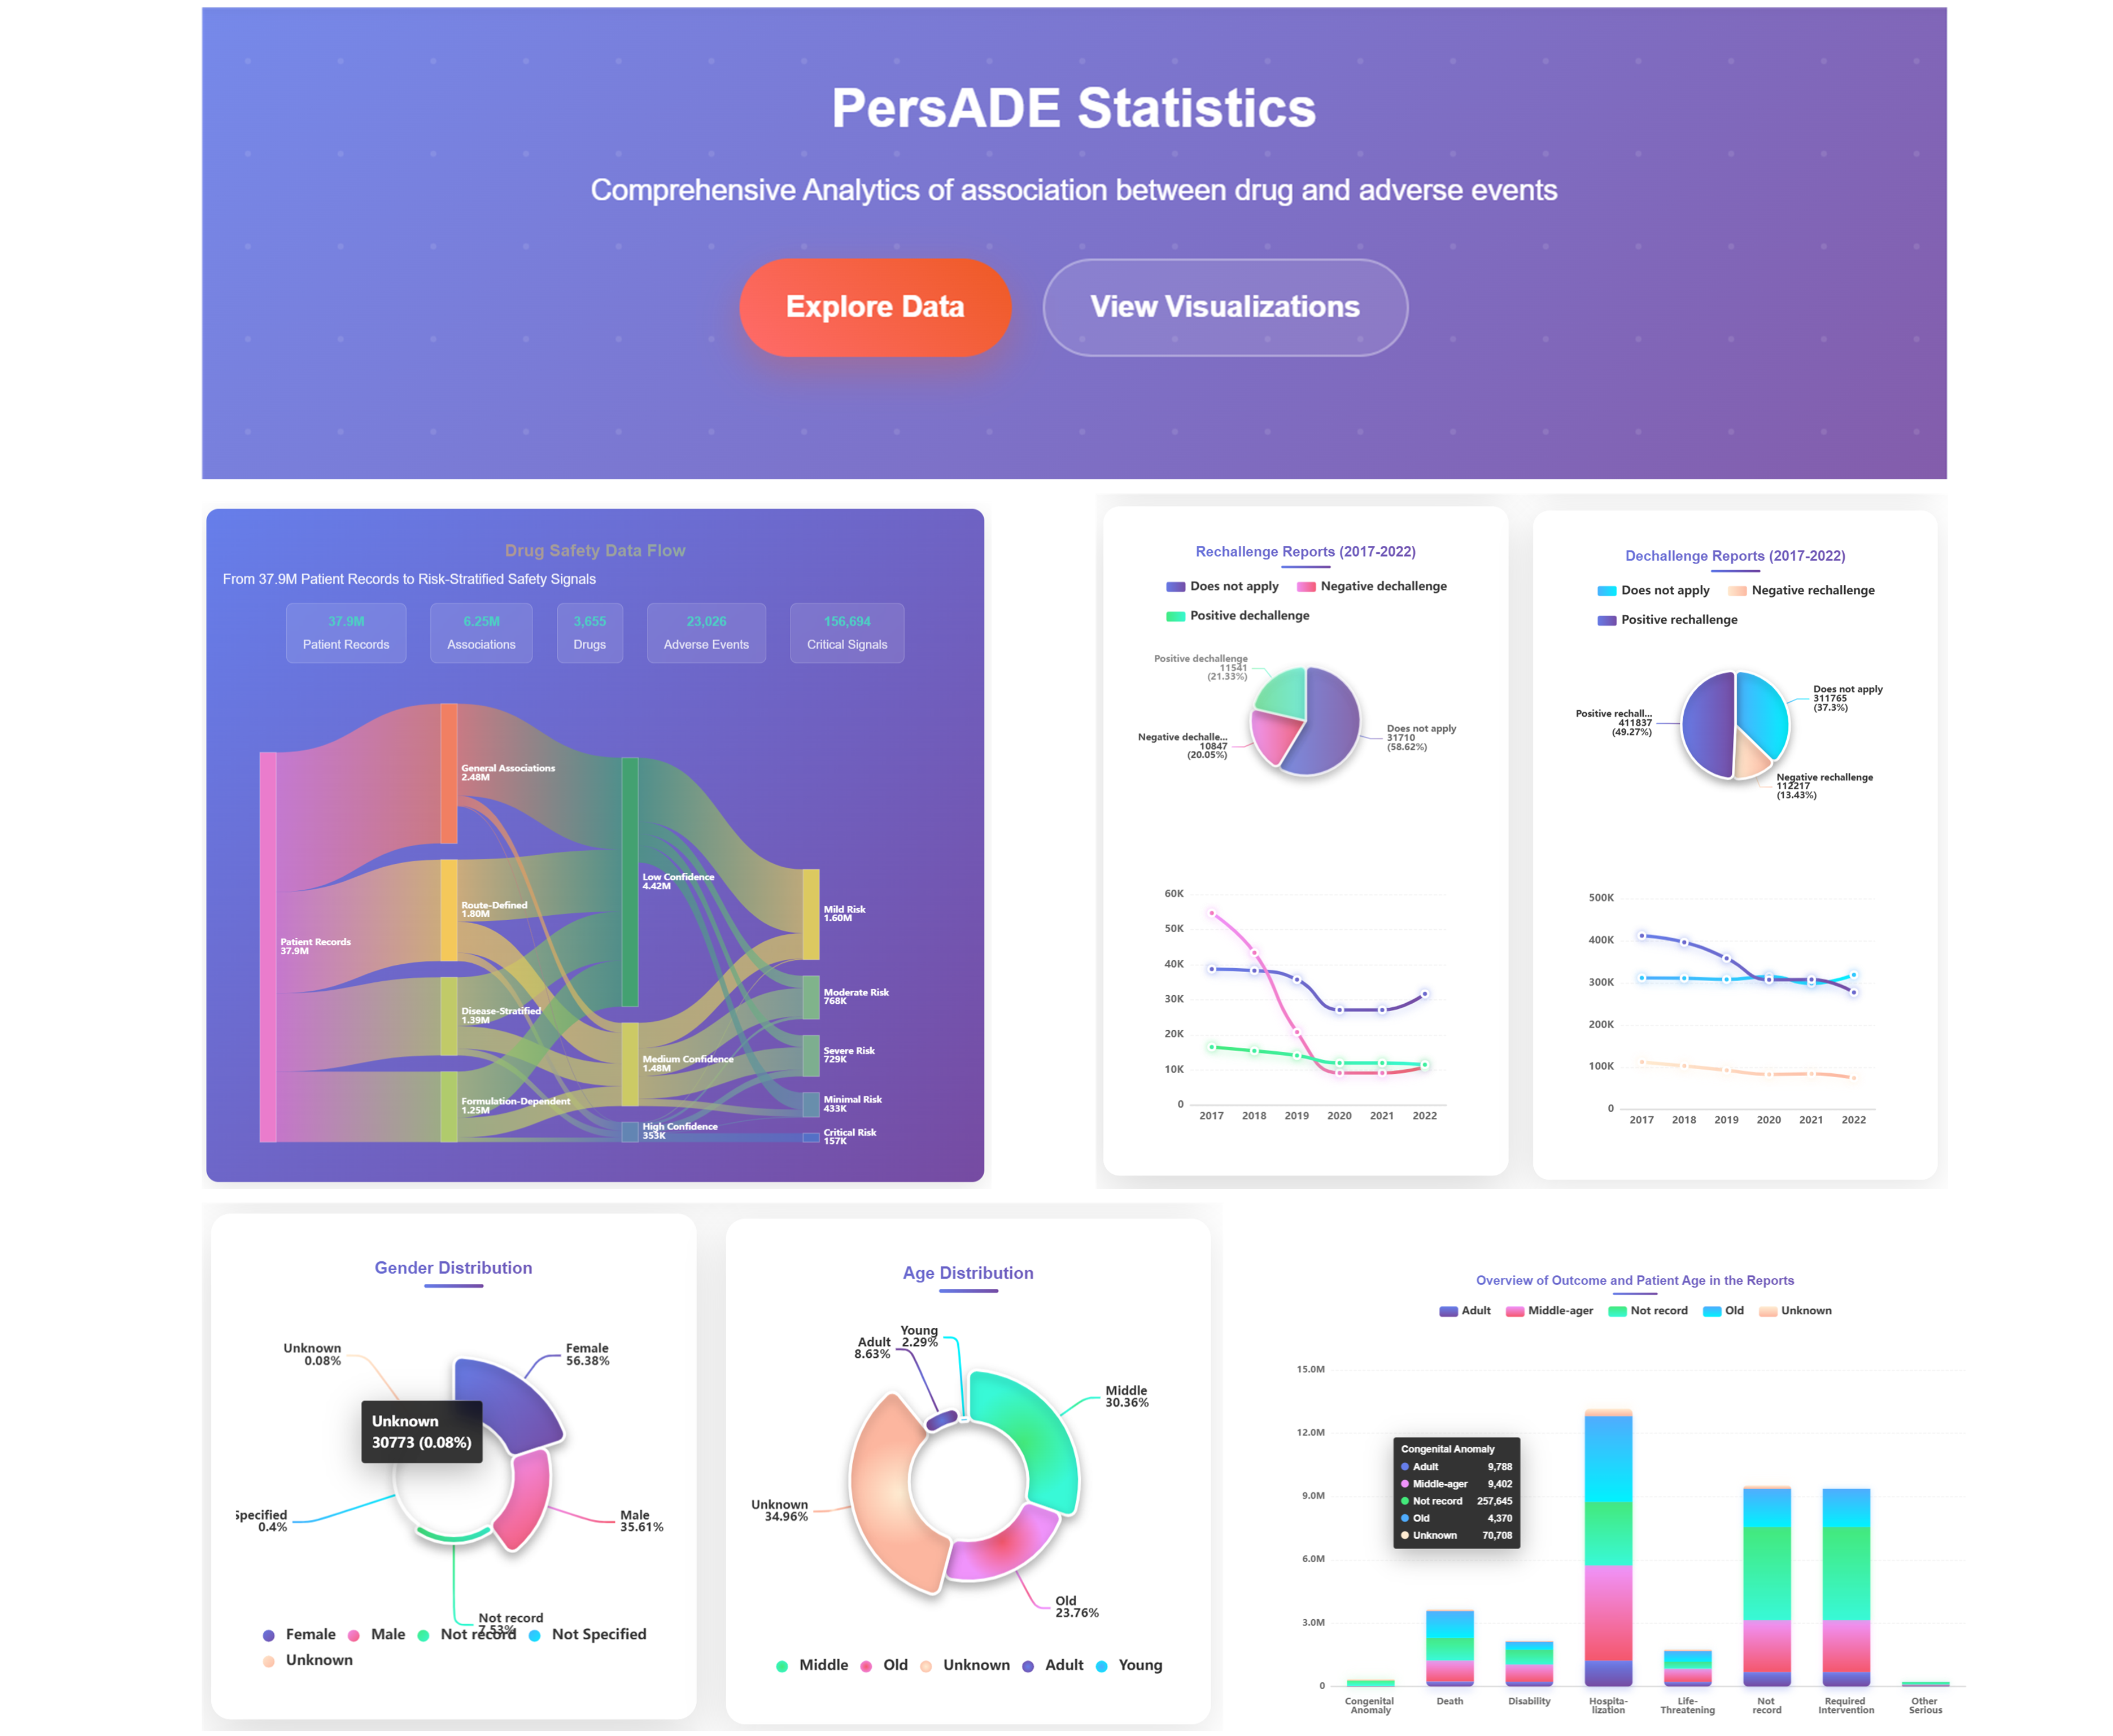
Access PersADE Statistics Interface
Navigate to the comprehensive analytics dashboard showing "PersADE Statistics - Comprehensive Analytics of association between drug and adverse events". Use "Explore Data" and "View Visualizations" buttons to access different analytical perspectives and interactive data exploration tools.
Analyze Drug Safety Data Flow
Examine the comprehensive data flow from 37.9M Patient Records through various processing stages including 5.1M Associations, 3.7K Drugs, 14.8K Adverse Events, to 134 Critical Signals. Understand the data processing pipeline from Clinical Associations to final Well-Defined Risk Categories.
Review Statistical Categories
Navigate through different risk stratification levels including Clinical Associations, Poorly-Defined Risk, Drug-Moderate Risk, Drug-Confidence High, Drug-Confidence Very High, to Critical Risk categories. Examine the systematic approach to safety signal classification and evidence strength assessment.
Access Interactive Visualizations
Click "View Visualizations" to access detailed statistical charts including Rechallenge Reports (2017-2022), Dechallenge Reports (2017-2022), temporal trend analysis, and comprehensive demographic breakdowns with interactive filtering capabilities.
📚 Resources & Data
Comprehensive dataset collections and research collaboration tools
📚 PersADE Resources Overview

Access PersADE Resources Platform
Navigate to the comprehensive resources platform for "Download comprehensive datasets of drug-adverse drug event (ADE) associations and related information to facilitate your research in pharmacovigilance and drug safety." Explore the extensive collection of curated datasets designed for research applications.
Search and Filter Datasets
Use the comprehensive search functionality to "Search for datasets, categories, or file types..." across the entire collection. Navigate through 47 Total Datasets organized into 3 Model Categories with the Latest Update in 2023 for comprehensive research support.
Browse Dataset Categories
Explore different dataset categories including "All", "mtADENet", "ADENet", "MetaADEDB", "Global", "2023", and "2021" classifications. Each category provides specialized datasets for different research methodologies and temporal analysis requirements.
Access Expandable Dataset Collections
Click "Click to expand" to access detailed dataset sections including "Networks for construction of mtADENet models", "Networks for construction of ADENet models", and "Data sets for construction of MetaADEDB" with comprehensive documentation and download options.
DEV TOOL